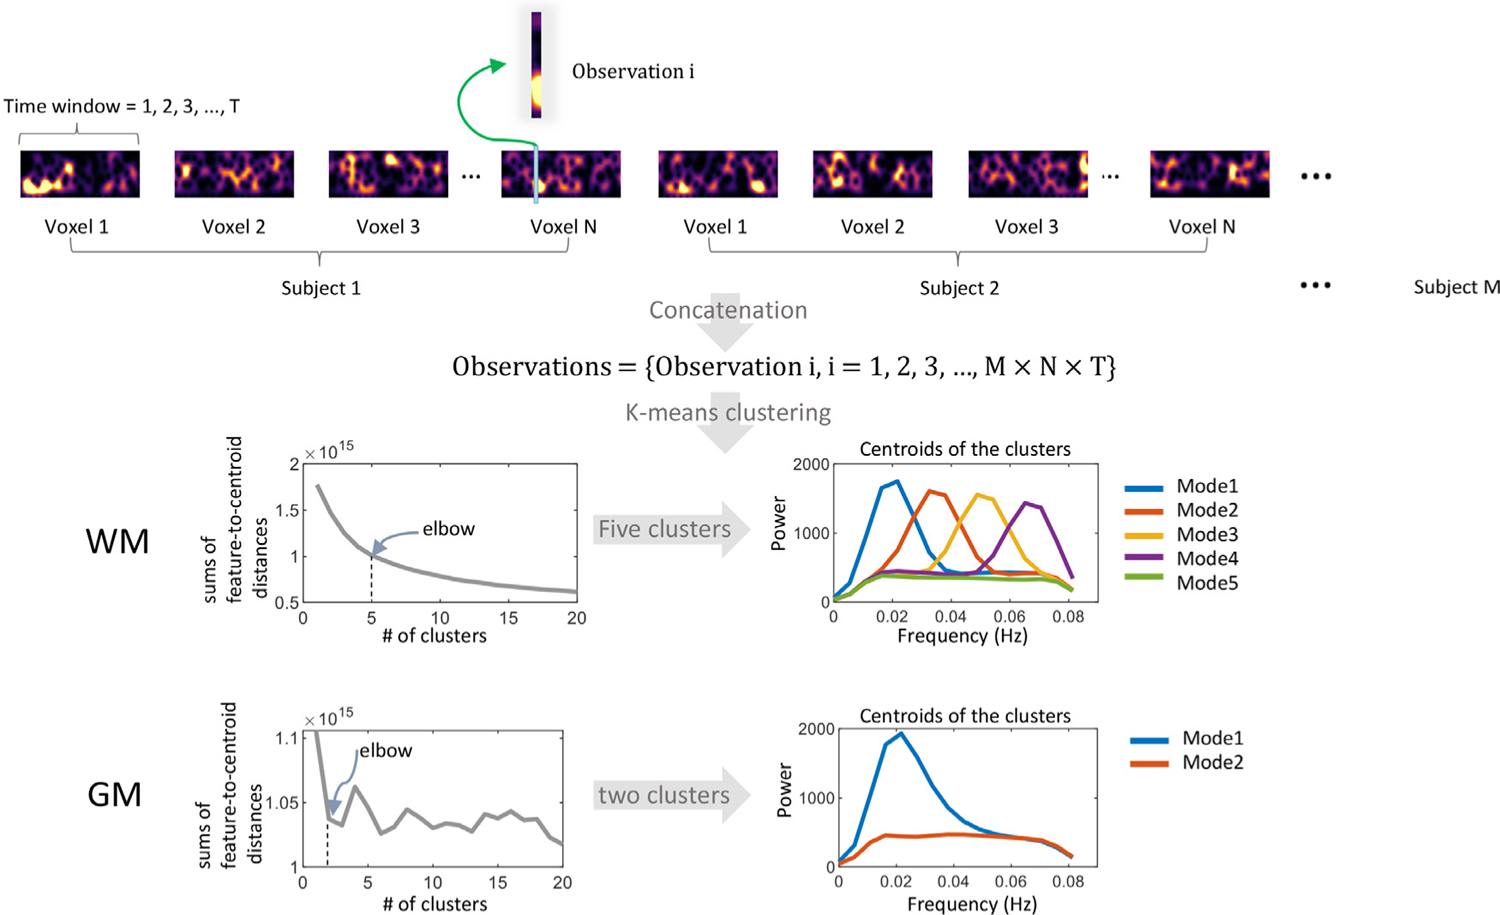
Fig. 1.

The workflow of calculating the spectral modes. A set of observations were generated by concatenating the spectrogram over voxels and subjects. Each observation is a vector, recording the spectra pattern of the signal corresponding to a specific time window. Observations were grouped into five clusters for WM and two clusters for GM using the K-means method. The elbow criterion was used to determine the optimal value of the # of clusters.
