
Fig. 4.
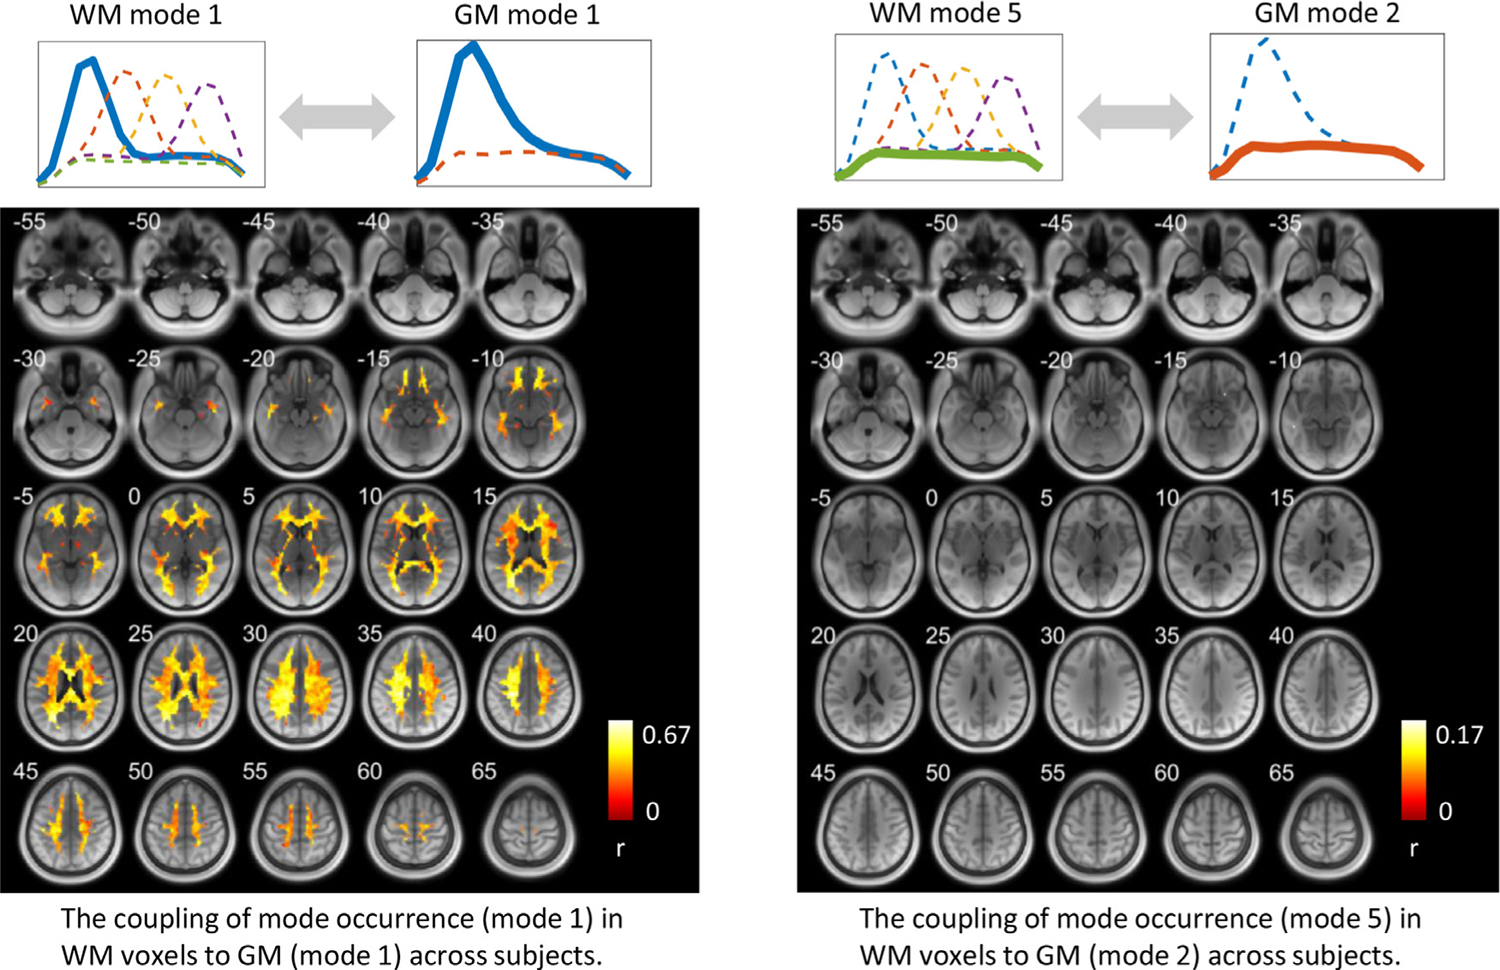
The coupling of mode occurrence in WM voxels to GM across subjects. The intensity of a voxel in the left figure indicates the Pearson’s correlation coefficient (r) between the occurrence of mode 1 at this WM voxel and the occurrence of mode 1 in the GM area shown in Fig. 3 (left) across subjects. The intensity of a voxel in the right figure indicates the Pearson’s correlation coefficient (r) between the occurrence of mode 5 at this WM voxel and the occurrence of mode 1 in the GM area shown in Fig. 3 (right) across subjects. Note that only significant (p<0.05) correlations are shown here.