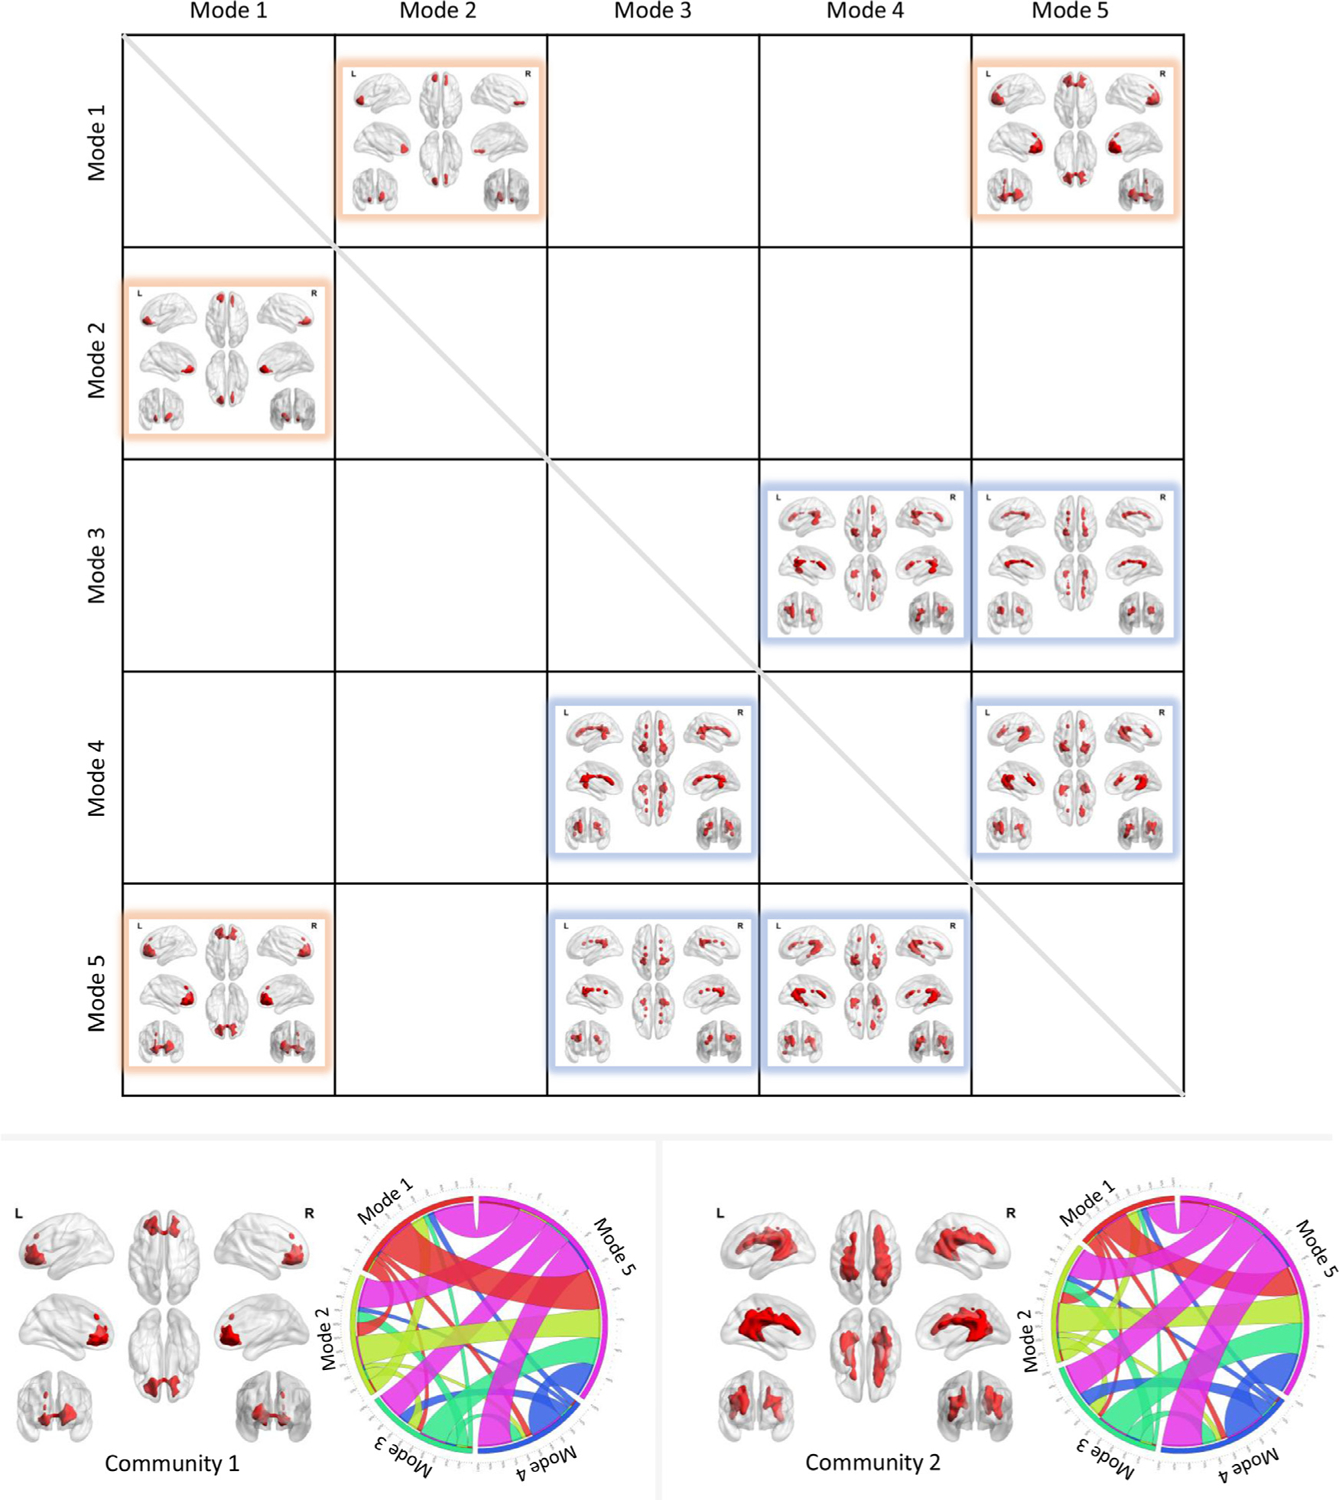
Fig. 6.

The transitions among modes. The upper figure visualizes the voxels that exhibit significantly higher transitions from mode i to mode j than the rest of WM voxels across subjects (one-sample t-test, p<0.05, FWE corrected). Two communities were identified and coded by different colors. The lower left panel shows the voxels that exhibit significantly higher transitions among modes 1, 2 and 5 (community 1), along with its transition probability among five modes shown on the right. The lower right panel shows the voxels that exhibit significantly higher transitions among modes 3, 4 and 5 (community 2), along with its transition probability among the five modes shown on the right.
