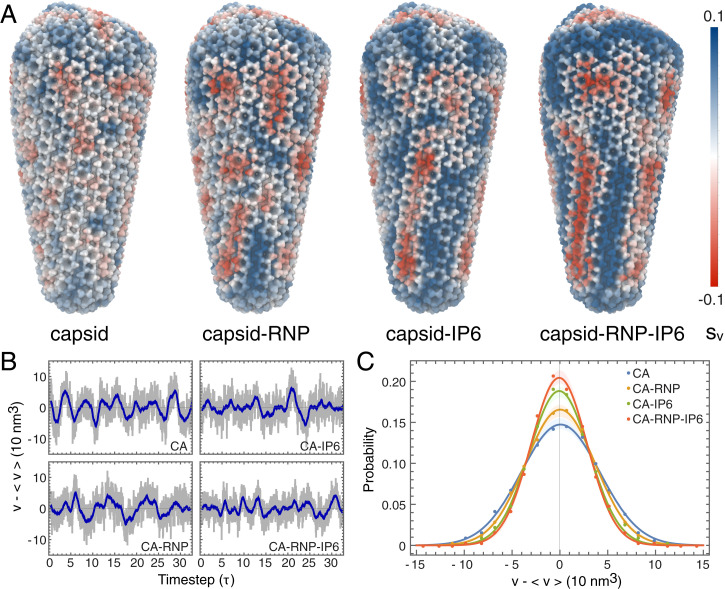
Fig. 2.
Strain and fluctuation analysis of the HIV-1 capsid. (A) The first invariant of the strain tensor () or volumetric strain was computed for each capsid core complex. Red and blue colors correspond to compressive and expansive strain, respectively. (B) Fluctuations in the HIV-1 core volumes, measured as deviations from the average capsid volume ( nm3). The subsampled timestep, τ, is 4 ns. Gray colors denote the instantaneous volume, whereas the blue line denotes a moving average within a one-timestep window. (C) Probability distributions for the volume fluctuation amplitudes in each capsid. Closed circles correspond to measured data, while the solid line indicates a Gaussian fit. The shaded regions denote the error in the distribution determined by block averaging.

