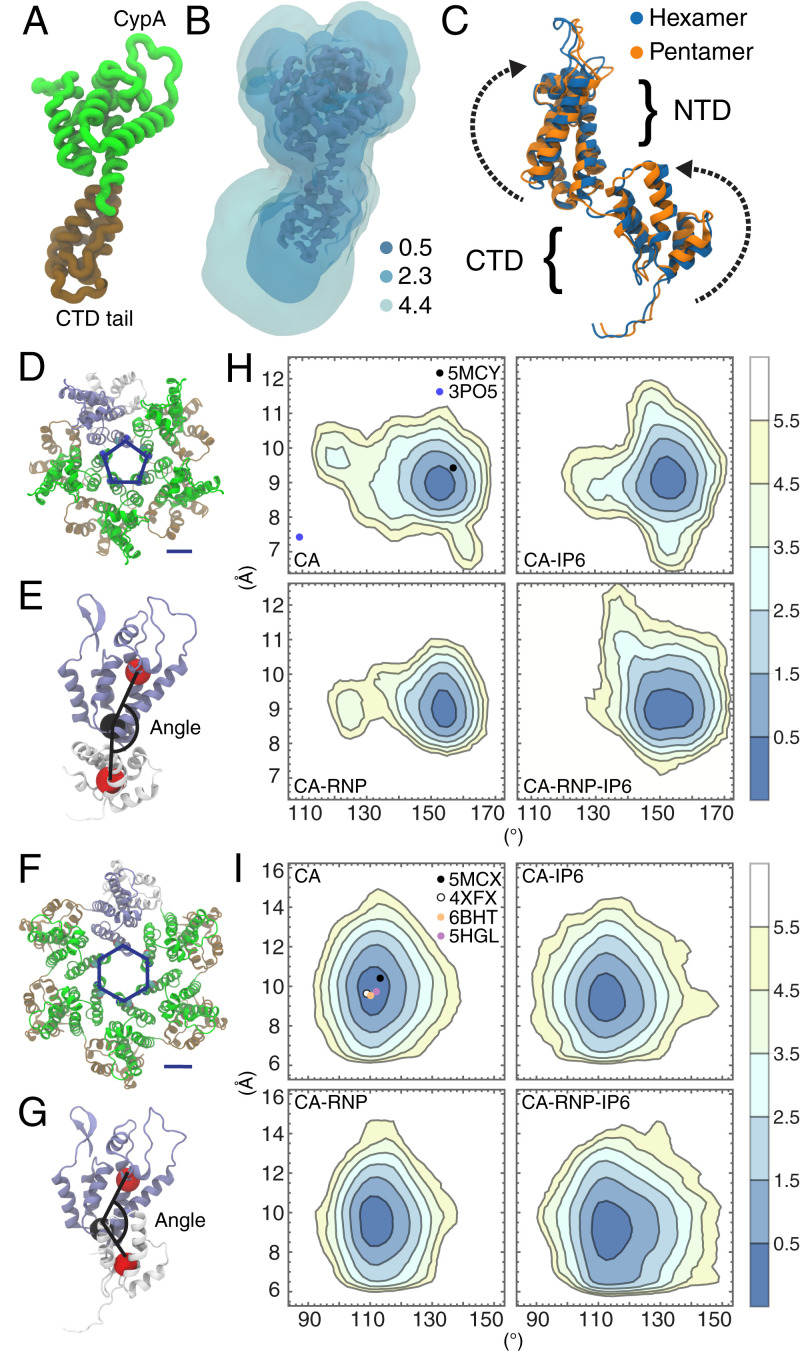
Fig. 3.
Conformational analysis of CA domain proteins. (A) A monomer of the CA protein. (B) The 3D potential of mean force for CA conformations contoured at 0.5, 2.3, and 4.4 kcal/mol with respect to the Cartesian coordinates of the protein heavy atoms. (C) Differences in CA monomer conformations between the cryo-EM structure of the hexamer (PDB ID: 5MCX) and cryo-EM structure of the pentamer (PDB ID: 5MCY) consist of rotations in the NTD and CTD. The parameter, ξ, is used to describe the pore size and is defined as the center-of-mass distance between residues N21 and A22. The angle Φ is used to describe the relative orientation of a NTD and adjacent CTD and is defined as the angle between three centers of mass across the NTD and CTD (red and black spheres). ξ and Φ are shown for the CA hexamer (D and E) and pentamer (F and G). (H) (ξ, Φ) distributions for the hexamers in each capsid. (I) (ξ, Φ) distributions for the pentamers in each capsid. Contour lines correspond to increments of , where is the probability. Closed circles correspond to (ξ, Φ) values from experimental structures in the Protein Data Bank.

