Fig. 5.
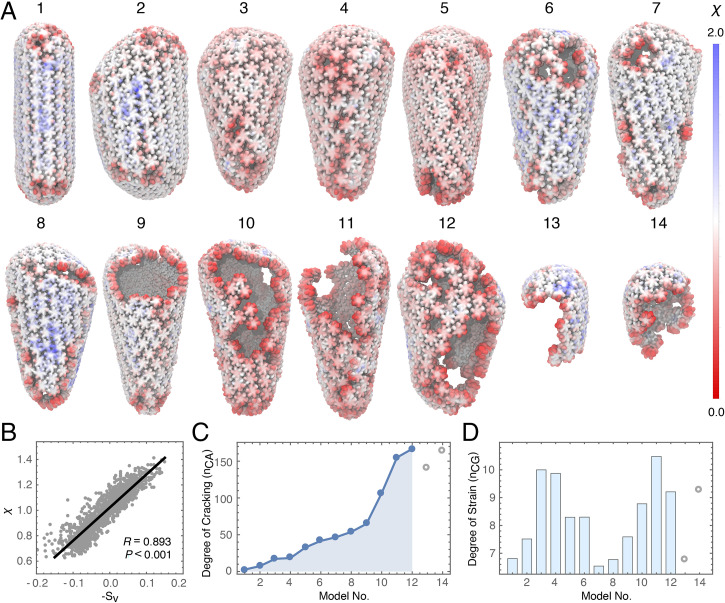
Cryo-ET of HIV-1 cores during rupture. (A) Cores were imaged by cryo-ET and lattice mapping during endogenous reverse transcription. Each structure (1 to 14) is colored by a local order parameter () that quantifies the degree of separation in the lattice. An ideally spaced particle in the lattice has a separation of . Red colors correspond to particles further apart on average from near-neighbors, whereas blue colors correspond to particles closer to near-neighbors. (B) Correlation between the strain () and lattice separation () measured in the MD simulations. (C) The degree of cracking in each capsid model measured by the number of CA monomers containing a particle with . (D) The degree of strain in each capsid model measured by the number of particles (103) with . Capsids 1 to 14 in A were ordered from no fractures to completely ruptured. Outliers in which the capsid was mostly disassembled are shown in open circles.

