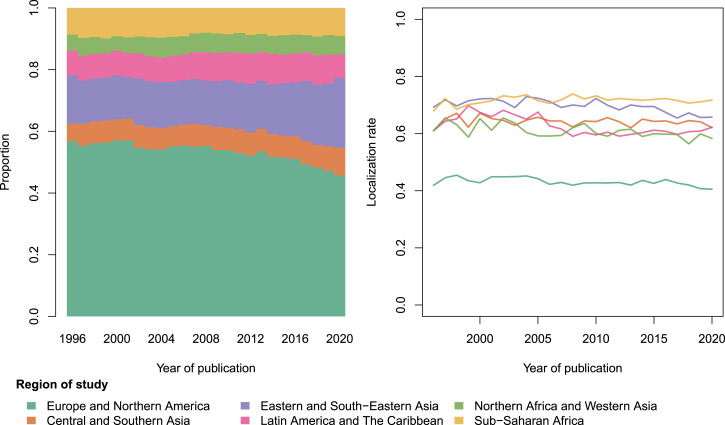
Fig. 1.
Distribution of the region of focus of articles in the analytical sample (Left) and localization rate by region of study (Right), 1996 to 2020 (n = 560,893). Note that the regional classification of countries is taken from the UN Sustainable Development Goals (https://unstats.un.org/sdgs/indicators/regional-groups/). We merge the category “Australia and New Zealand” into one category, “Europe and Northern America,” and excluded papers about Oceania because of the small sample size (n = 1,583).

