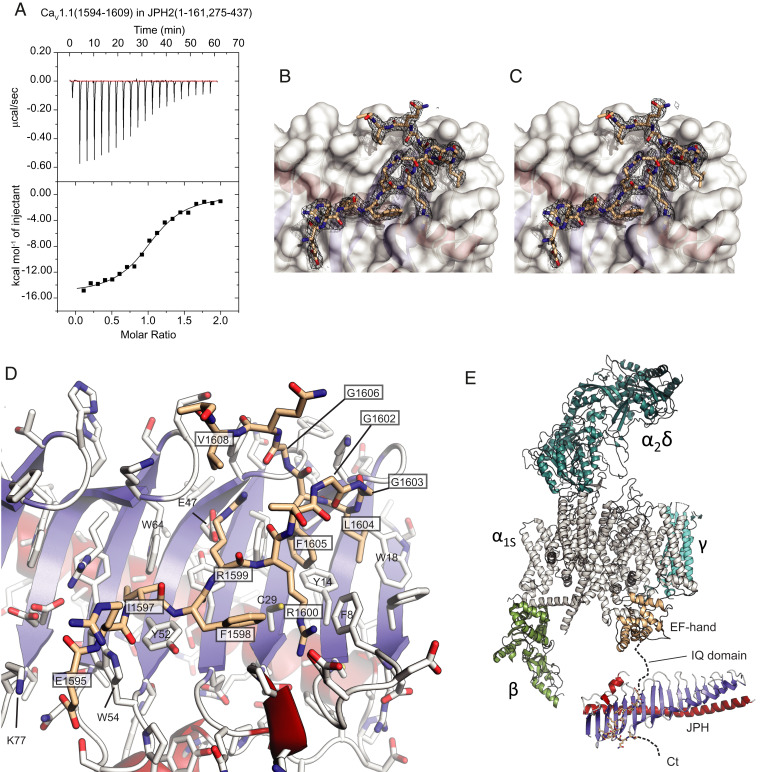
Fig. 2.
Interactions between JPH2 and a CaV1.1 peptide. (A) Representative ITC titration of 300 μM CaV1.1 peptide into 30 μM JPH2 (1 to 161, 275 to 437) (Kd = 1.6 μM). (B) Final 2mFo–DFc density and (C) composite omit map for the CaV1.1 peptide shown as a black mesh, both contoured at σ = 1. The white surface corresponds to JPH2. (D) Close-up of the CaV1.1 peptide (beige) bound to JPH2. Boxed labels correspond to CaV1.1, with others corresponding to JPH2. Blue: β-strands; red: α-helices. Side chains are shown in stick representation with oxygens in red and nitrogens in blue. (E) Structure of the junctophilin complex in relationship to a cryoelectron microscopy structure of CaV1.1 (PDB ID code 5GJW). Different subunits are labeled. The α1S subunit is shown in gray, with the EF-hand domain in the C terminus in beige. The JPH binding site is 50 residues downstream of the IQ domain.

