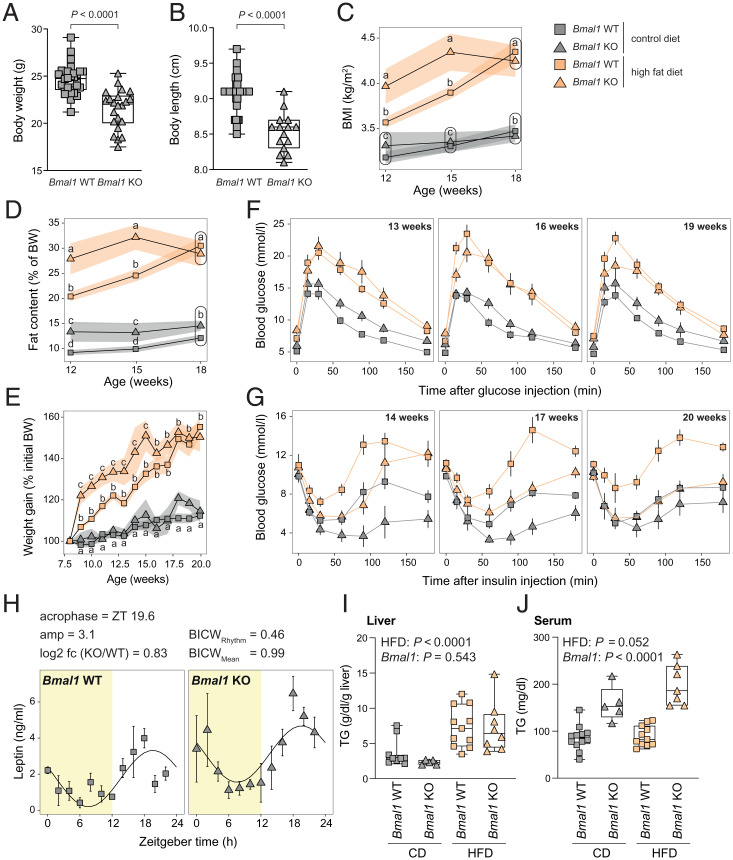
Fig. 2.
Bmal1 KO mice under HFD exhibit an early obese phenotype but no sign of prediabetes. (A and B) Body weight (A) and size (B) of Bmal1 of WT and KO mice before the treatment with HFD or CD. n = 22 to 32 mice (A) and 15 to 37 mice (B) per genotype. (C) BMI of indicated genotype and feeding regimen throughout the experiment. The size and weight were measured at ZT3. n = 6 to 19 mice per genotype and week. (D) Relative fat content measured by EchoMRI throughout the experiment. n = 6 to 19 mice per genotype and week. (E) The relative weight gain of Bmal1 WT and KO mice fed under HFD or CD. The body weight of the mice was measured at ZT3. n = 4 to 17 mice per condition and week. (F) Glucose tolerance tests performed on 13-, 16-, and 19-wk-old mice at ZT3 after 15 h of fasting. n = 6 to 17 mice per condition and week. (G) Insulin tolerance tests performed on 14-, 17-, and 20-wk-old mice at ZT3. n = 4 to 14 mice per condition and week. (H) The temporal serum leptin concentration in Bmal1 WT and KO under CD. n = 3 mice per time point and genotype. (I and J) Liver (I) and serum (J) triglycerides concentration at ZT12 in Bmal1 WT and KO mice fed with CD or HFD. n = 5 to 12 mice per condition. ZT is defined as follows: ZT0, lights on; ZT12, lights off. Statistical tests included unpaired Student’s t test (A and B), dryR (H), linear models (C–E; see details in Materials and Methods), and two-way ANOVA (I and J). Means with different letters are significantly different (P < 0.05; C–E).

