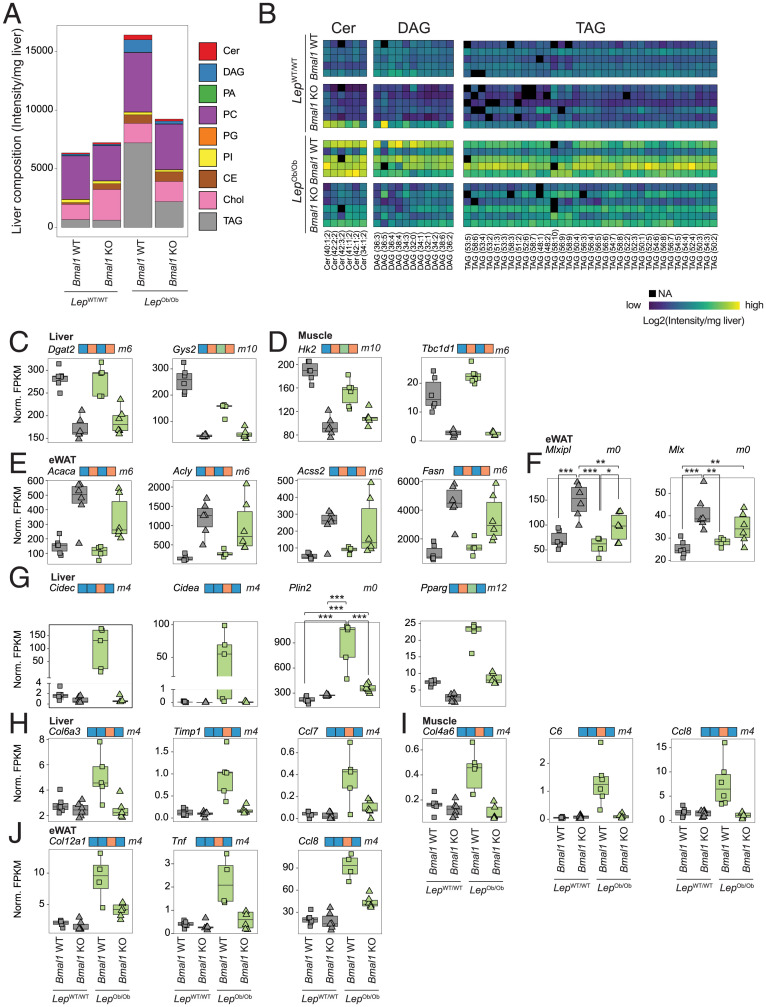
Fig. 4.
BMAL1 controls lipid metabolism and storage. (A) Global liver lipids composition analyzed by lipidomics in each group of mice liver at ZT12. Values represent average of n = 5 to 6 mice per genotype. TAG: triacylglycerides, Chol: cholesterol, CE: cholesteryl esters, PI: phosphatidylinositols, PG: phosphatidylglycerols, PC: phosphatidylcholines, PA: phosphatidic acid, DAG: diacylglycerides, Cer: ceramides. (B) A heatmap of the abundance of the lipid species associated with insulin resistance (Cer, DAG, and TAG) in the livers of individual mice. (C–E) The expression of genes encoding enzymes involved in glucose and lipid metabolism measured by RNA-seq at ZT12 in liver (C), muscle (D), and eWAT (E). n = 5 to 6 mice per genotype. (F) The expression of the carbohydrate-responsive element-binding protein and its heterodimerization partner measured by RNA-seq at ZT 12 in eWAT. N = 4 to 6 mice per genotype. (G) The expression of genes encoding proteins involved in lipid storage measured by RNA-seq in the liver at ZT12. N = 4 to 6 mice per genotype. (H–J) The expression of markers of inflammation and fibrosis measured by RNA-seq at ZT12 in liver (H), muscle (I), and eWAT (J). n = 4 to 6 mice per genotype. For statistical analysis, generalized linear models were employed (C–I; see details in Materials and Methods). Differences in expression level between the genotypes are defined in SI Appendix, Fig. S4A and are indicated on top of the graph. Genes that follow an ambiguous model are marked m0, and P values for each significant contrast are provided. ***P < 0.001, **P < 0.01, and *P < 0.05.

