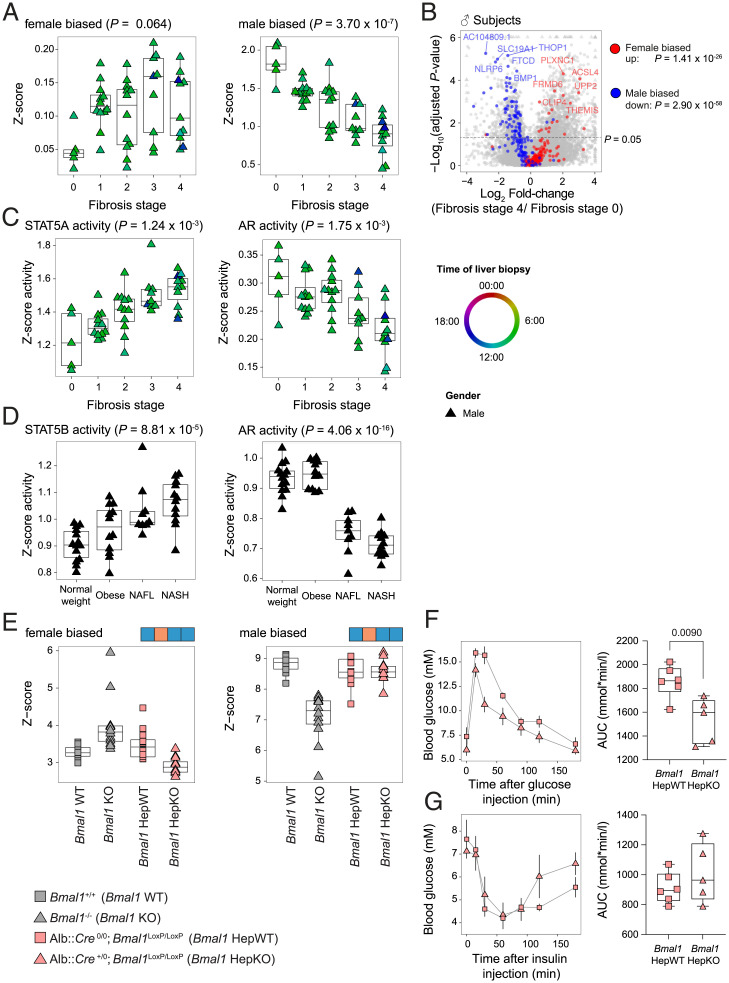
Fig. 6.
The feminization of gene expression increases during development of NAFL and NASH in humans but not in Bmal1 HepKO mice. (A) The differential expression of female- and male-biased genes in the livers of humans at different stages of fibrosis. n ≥ 12 subjects per stage. (B) A volcano plot representing the differential expression of the sex-biased genes in the livers of individuals with fibrosis stage 0 or 4. Colors indicate male-biased (blue), female-biased (red), and unbiased (gray) expressed genes. n ≥ 12 subjects per stage. (C) The predicted activity of STAT5 and AR in the livers of individuals at different stage of fibrosis. (D) The predicted activity of STAT5 and AR in the livers of individuals with normal weight, obesity, simple steatosis (NAFL), or NASH. n ≥ 9 subjects per condition. (E) The differential expression of female- and male-biased genes in the livers of Bmal1 KO and Bmal1 HepKO mice (n = 12 per genotype). (F) Glucose tolerance tests performed on 9-wk-old Bmal1 HepKO and hepatocyte-specific WT (HepWT) littermates at ZT3 after a 15-h fasting. Data represent glucose concentrations over time (Left) and area under the curve (Right). n = 5 to 6 mice per genotype. (G and H) Insulin tolerance tests performed at ZT3 on 10-wk-old Bmal1 HepKO and HepWT littermates. Data represent glucose concentrations over time (Left) and area under the curve (Right). n = 5 to 6 mice per genotype. Statistical tests included linear models (A, C, and D; for details, see Materials and Methods), mean-rank gene set test (B), dryR (E), and two-tailed unpaired Student’s t test (F and G).

