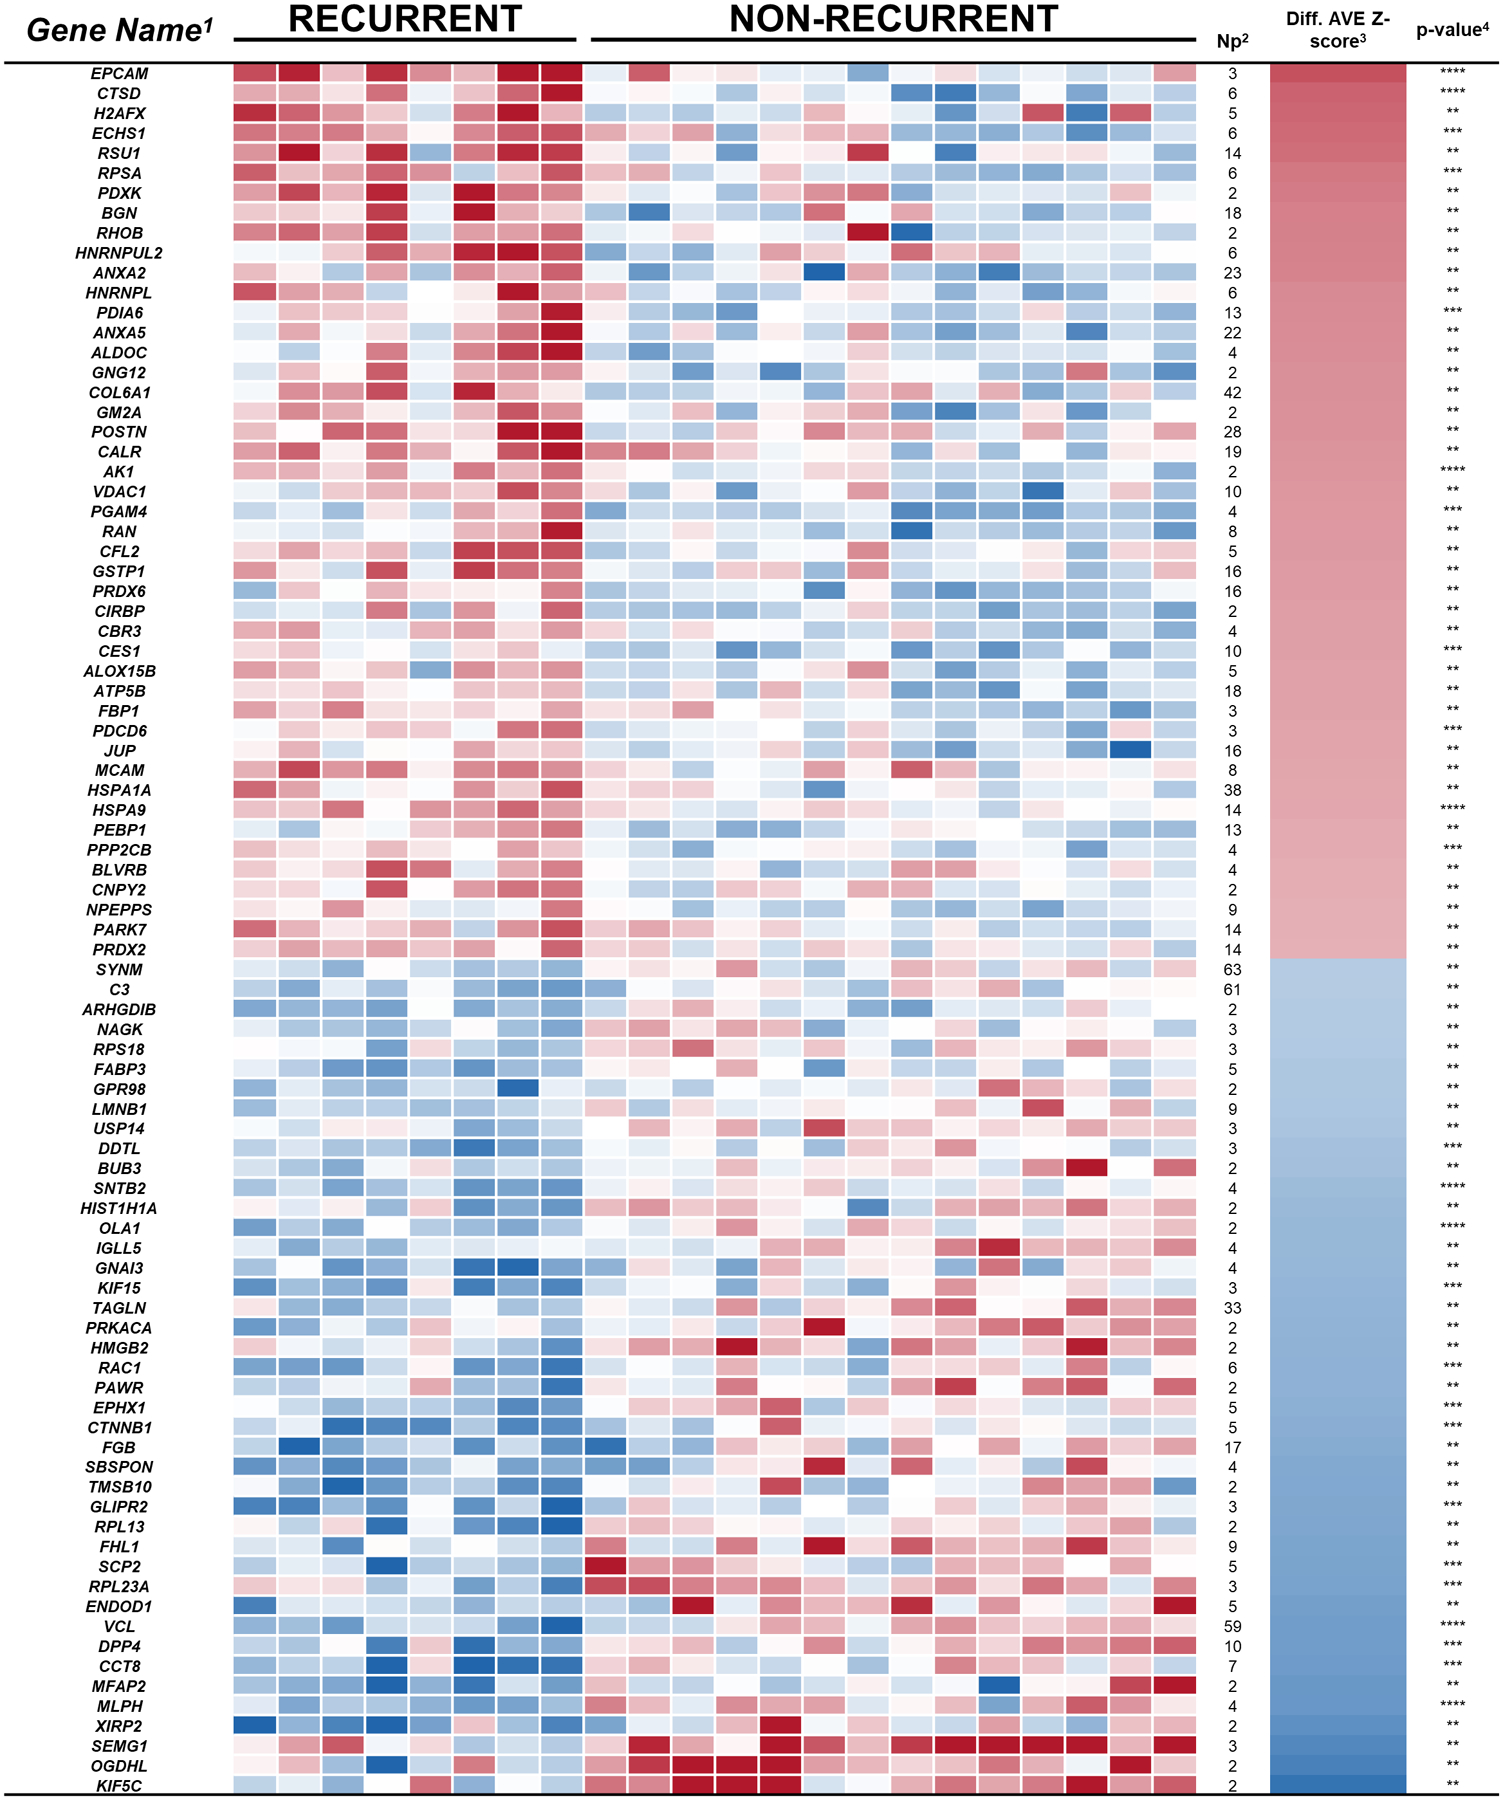
Figure 2. Heat map of significant proteins differences between recurrent versus non-recurrent tissue samples (P < 0.01, Np > 1).

Relative (cancer/normal) levels of proteins with significant differences between tissue samples from recurrent versus non-recurrent prostate cancer patients are shown. The intensity of the color represents the concentration change between prostate cancer and normal (log2) from −4 (blue) to 4 (red), determined by label-free quantification. 1Official Gene Name of Protein FASTA Description, 2Number of unique identified peptides (FDR < 0.01), 3Average of the difference of standardized quantification at protein level (Zq), and 4Student’s t-test p-value for two normalized populations of equal standard deviation.
