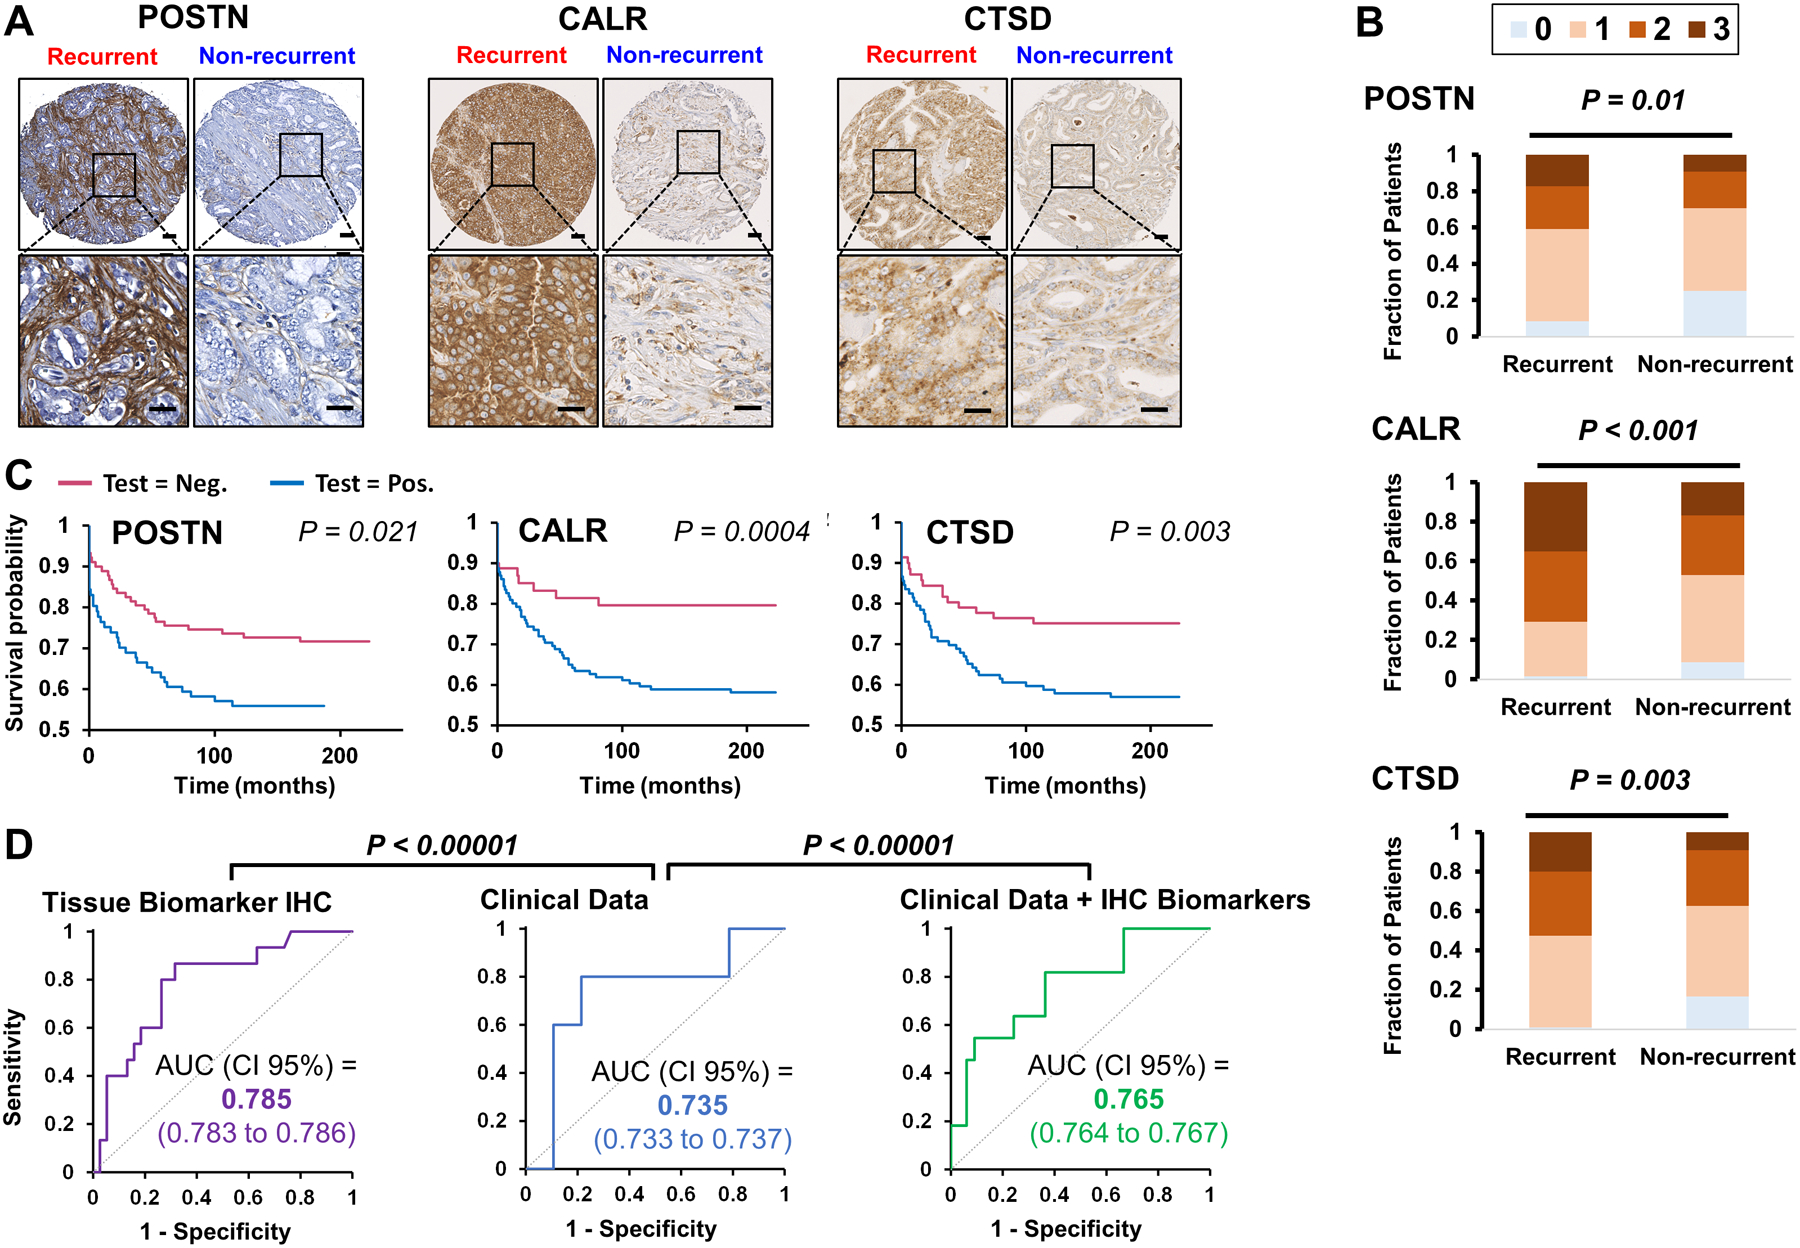
Figure 4.

(A) POSTN, CALR, and CTSD is elevated in tissue of recurrent prostate cancer. Representative IHC images of recurrent and non-recurrent prostate cancer. Scale bars represent 50 microns and 25 microns. (B) POSTN, CALR, and CTSD are positively associated with prostate cancer biochemical recurrence. Strong staining for POSTN, CALR, and CTSD correlates (P = 0.01, P < 0.001, and P = 0.003, respectively), with prostate cancer recurrence (N=124). (C) Kaplan-Meier Survival Analysis. Survival analysis of POSTN, CALR, and CTSD of average TMA staining correlates (P = 0.021, 0.0004, 0.003, respectively) with prostate cancer recurrence. (D). ROC curves of LDA models. The use TMAs staining data of POSTN, CALR, and CTSD alone (purple) or in addition to clinical data (green) improves clinical data (blue) only performance of prostate cancer patient’s classification (P < 0.00001).
