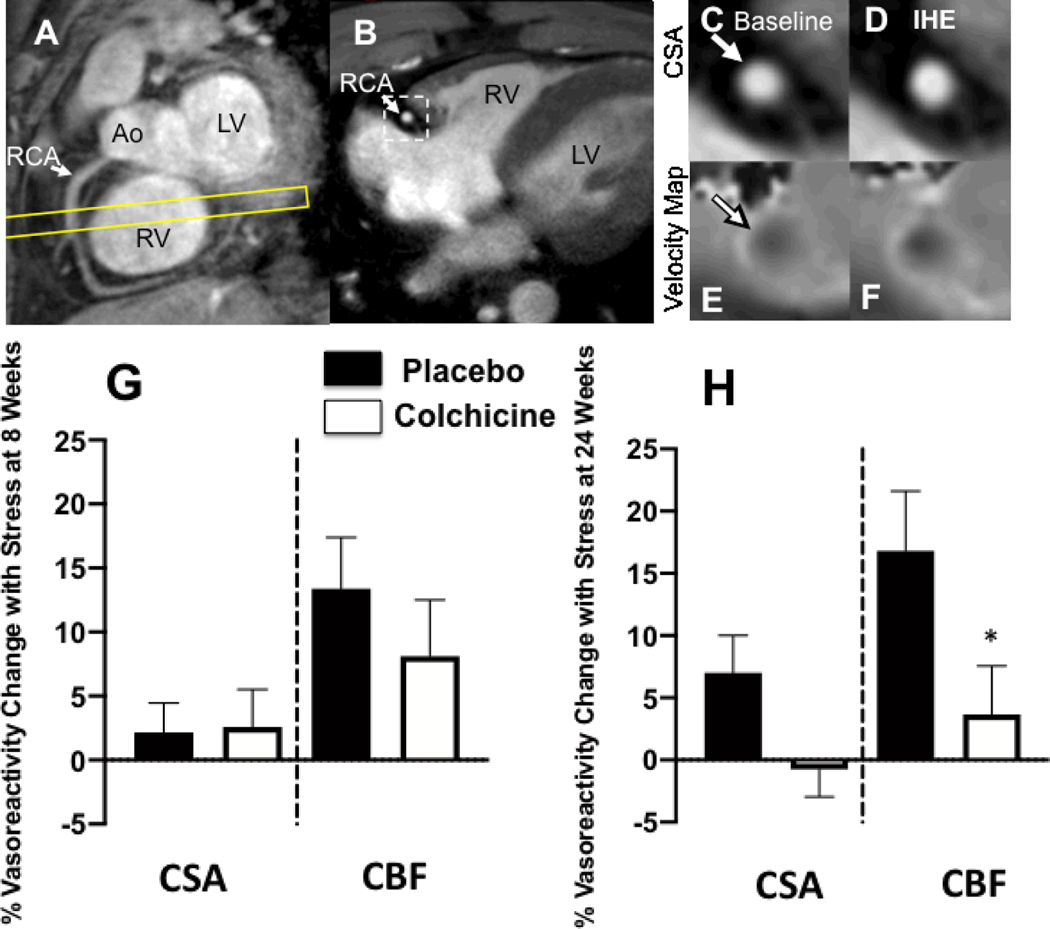
Figure. 2:
Representative coronary artery MRI images for CEF. (A) A scout MRI obtained parallel to the right coronary artery (RCA) is shown with the location for subsequent cross-sectional imaging (yellow outline). (B) Image acquired along the yellow-outlined region in (A) with RCA in cross-section (white arrow). The dotted rectangle in B is magnified in subsequent panels and shows the region analyzed for cross-sectional area at rest (C) and during isometric handgrip exercise (IHE), D). Flow velocity images of the same segment at rest (E) and during IHE (F) using a phase contrast technique wherein signal darkness increases only slightly during IHE, indicating an impaired response. G and H: Relative changes (%) in coronary artery cross sectional area (CSA), and coronary blood-flow (CBF) using MRI during isometric handgrip exercise at 8 weeks (G) and 24 weeks (H). Percent change in coronary vasoreactive parameters with IHE are shown for those on colchicine (red) and placebo (blue). Error bars indicate standard error of the mean. There were no significant differences in coronary endothelial function parameters between the placebo and anti-inflammatory treatment at the 8 week (primary) en point. % CBF change was lower in the colchicine than placebo group (*p=0.05) at 24 weeks. Ao=aorta; LV=left ventricle, RV=right ventricle.

