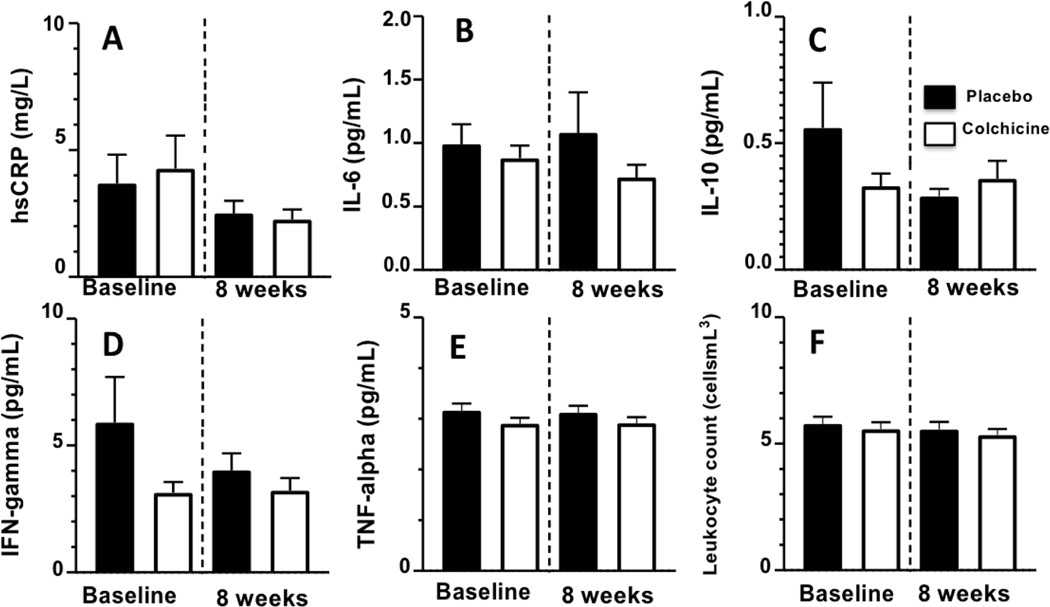
Figure 3:
Bar graphs showing serum biomarkers (mean values) at baseline and at 8 weeks after randomization to colchicine (red bars) or placebo (blue bars) in people living with HIV. Error bars indicate standard error of the mean. There were no significant differences in level of inflammatory biomarkers (A-F) between groups.

