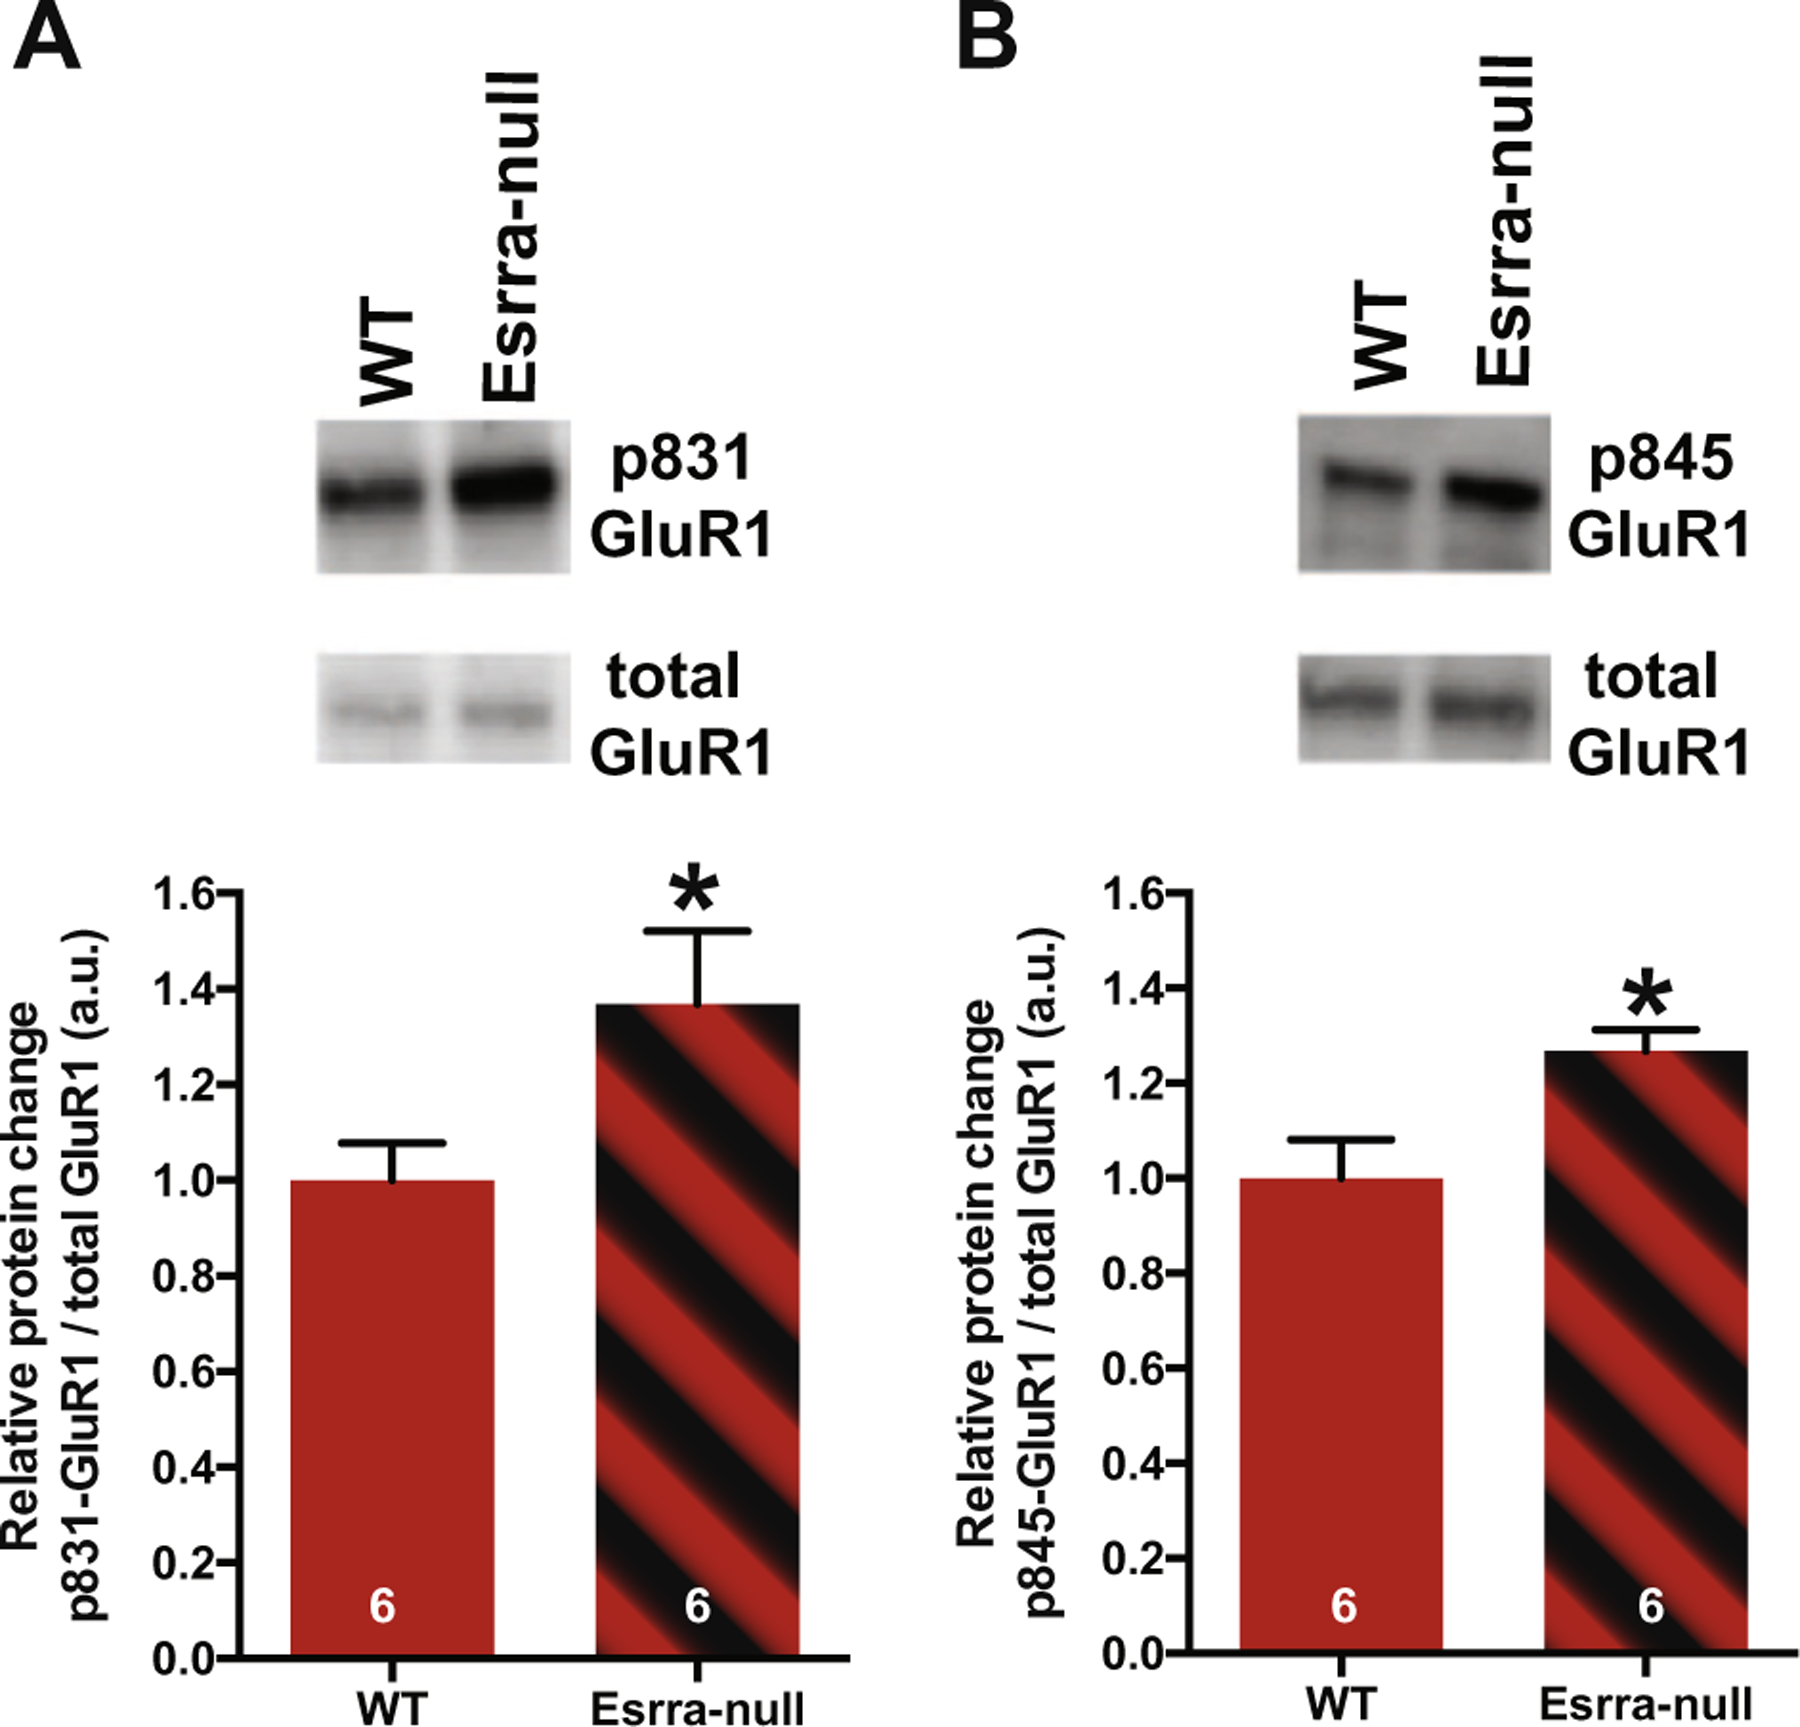
Fig. 3.

Increased levels of phosphorylation of GluR1 at Ser831 and Ser845 in nucleus accumbens of female Esrra-null mice. (A, B) Representative Western blot images of phosphorylated and total GluR1 in NAc (top) and densitometric analysis of phospho- to total GluR1 ratio in female WT and Esrra-null mice (bottom). Data presented as mean ± S.E.M. *p < 0.05 indicates significant differences between the groups (Mann–Whitney U test).
