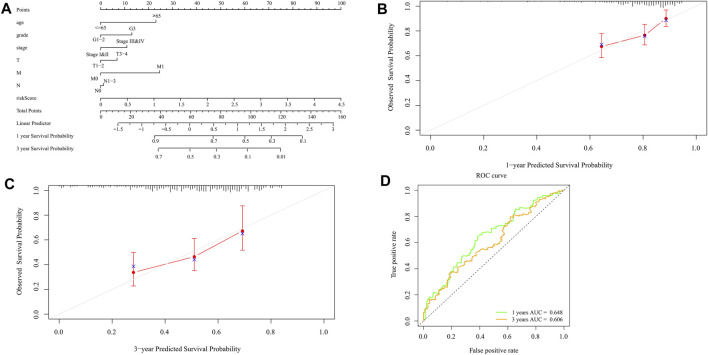
FIGURE 10.
Construction and validation of the nomogram. (A) Scores of each item of GC patients were calculated according to the nomogram, and the total scores obtained after addition can predict the 1- and 3-year survival probability. (B,C) The 1- and 3-year calibration curves of the nomogram (D) The ROC curves of 1-and 3-year nomogram (AUC = 0.648 for 1 year, AUC = 0.606 for 3 years). The abscissa represents false positive rate, the ordinate represents true positive rate.

