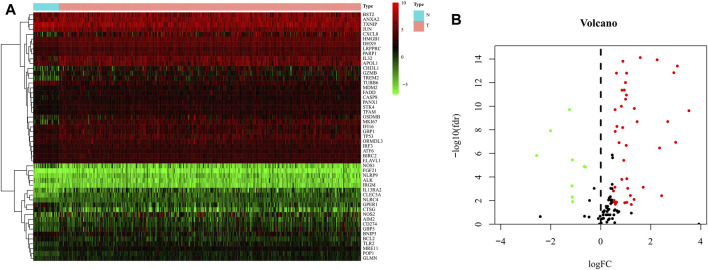
FIGURE 2.
Identification of differential expressed genes (DEGs) in GC and normal tissues. (A) Heat map of 51 DEGs in TCGA. Red: upregulation; Green: downregulation. The abscissa represents the type, N normal; T Tumor; ordinate represents the gene. (B) Volcano plots of the distributions of 51 DEGs. The abscissa represents logFC and the ordinate represents -log10 (FDR).

