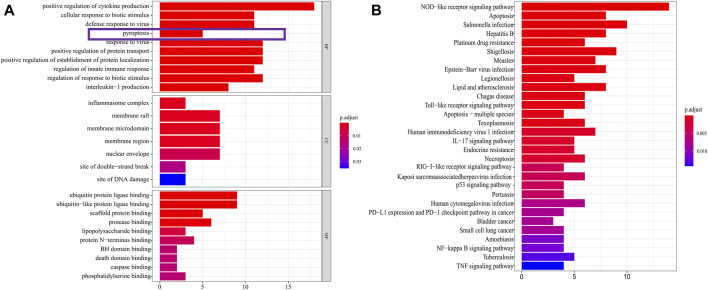
FIGURE 3.
DEGs enrichment analysis. (A) The results of GO enrichment in the TCGA cohort. “BP” stands for “biological process,” “CC” stands for “cellular component” and “MF” stands for “molecular function”. The abscissa represents the gene ratio. (B) The results of KEGG enrichment in the TCGA cohort. The abscissa represents the gene ratio.

