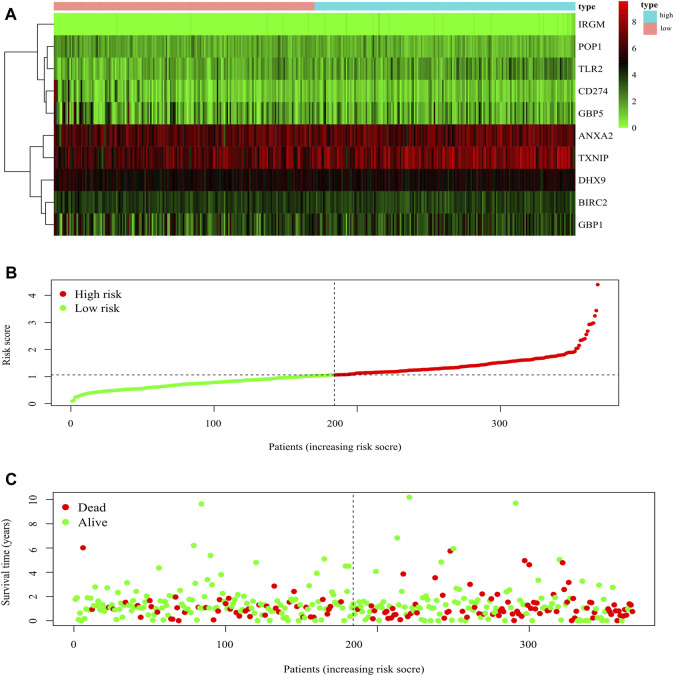
FIGURE 5.
Characteristics of prognostic gene signatures. (A) The heatmap of the ten DEGs expression profiles in high- and low-risk GC patients. The abscissa represents risk types, the ordinate represents the gene. (B) Distribution of risk scores of high- and low-risk GC patients. The abscissa represents the patients (increasing risk score), the ordinate represents the risk score. (C) The scatter plot shows the correlation between survival time and risk score. The abscissa represents the patients (increasing risk score), the ordinate represents survival time (years).

