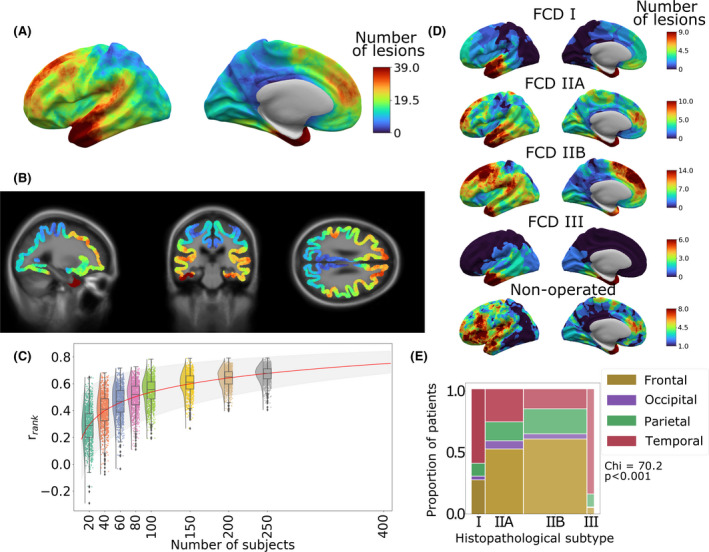
FIGURE 1.

Distribution of focal cortical dysplasia (FCD) lesions across the cerebral cortex. (A) All FCD lesion masks mapped to the left hemisphere of the template cortical surface. The distribution of FCDs across the cerebral cortex is nonuniform, with higher concentrations in the superior frontal sulcus, frontal pole, temporal pole, and superior temporal gyrus. (B) Three‐dimensional lesion likelihood atlas. Aggregated surface‐based lesion map values were normalized to between 0 and 1 and mapped back to the template magnetic resonance imaging volume. (C) Sample size required for consistent FCD lesion map. Rank correlation (y axis) was calculated by comparing the lesion map from a smaller cohort to a larger withheld cohort (n = 250). rrank increased with sample size. Predictive learning curve (red line) estimated that a stable map of lesion distribution requires a sample size of n = 400. (D) Distribution of FCD lesions according to histopathological subtype. (E) Distributions of lesions across cortical lobes within each FCD histopathological subtype. The width of bars indicates the relative numbers of patients. Temporal lobe lesions made up larger proportions of FCD Types I and III, whereas frontal lobe lesions were more likely to be FCD Types IIA and IIB
