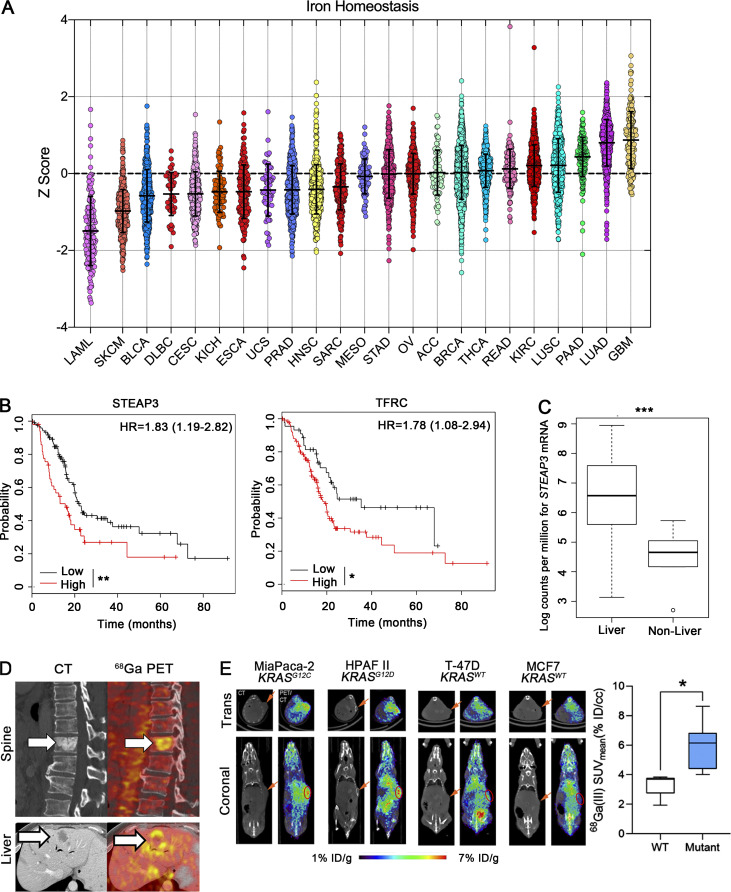
Figure 1.
A ferrous iron signature is prognostic in pancreatic adenocarcinoma. (A) Pan cancer analysis of iron homeostasis. Z-sores are plotted for each of 23 tumor types. Medians for each tumor type are ranked from lowest to highest (L→R). Error bars represent mean ± SEM. (B) PAAD patients were binarized into high (upper half) or low (lower half) of mRNA expression of STEAP3 and TFRC. Survival in months was estimated by the method of Kaplan and Meir (log-rank test, **, P < 0.01; *, P < 0.05). HR = hazard ratio for overall survival. (C) Boxplot showing median STEAP3 expression in hepatic metastases vs. other metastatic sites in PDA patients profiled in Aguirre et al. (2018). ***, P < 0.001. (D) Representative CT (left) and fused Ga68 citrate PET/CT (right) images demonstrating Ga68 citrate avid metastases within the T10 vertebral body and liver from two patients with PDA. White arrows indicate metastatic sites. (E) Representative Ga68 PET images of mice bearing xenografts with wild-type or mutant KRAS. Tumors bearing an oncogenic KRAS mutation have an increased avidity for Ga68. Error bars represent mean ± SEM, n = 3 mice/group and analyzed by a two-sample t-test. *, P < 0.05. Orange arrows (E) indicate the site of subcutaneous flank tumors in mice on CT.

