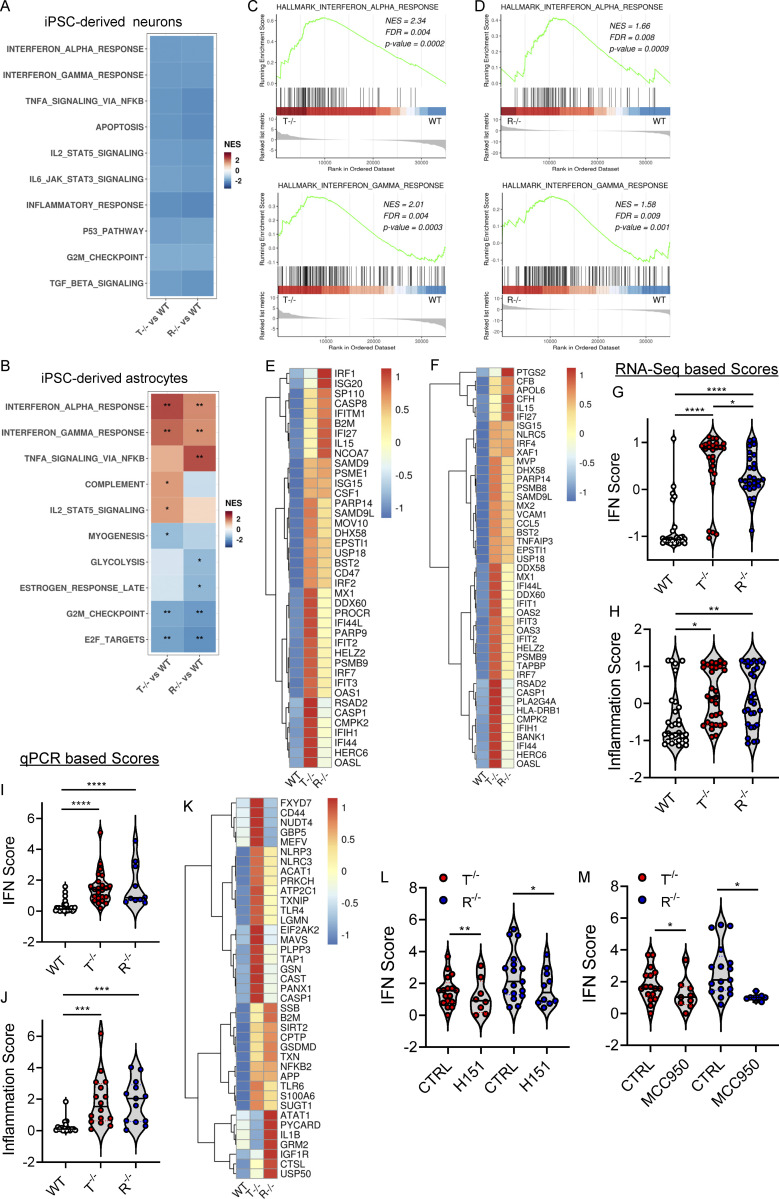
Figure 2.
KO iPSC–derived astrocytes spontaneously activate type I IFN and proinflammatory responses. (A and B) Heatmap visualizing the significant enriched GSEA terms in iPSC-derived neurons (A) and iPSC-derived astrocytes (B) against the Hallmark gene set (Molecular Signatures Database). GSEA was performed on logFC preranked gene lists obtained from T−/− and R−/− gene expression compared with WT. (NES, normalized enrichment score; *, adjusted P < 0.05; **, adjusted P < 0.01 for upregulated pathways.) (C and D) Enrichment plots showing the GSEA results of the hallmark IFNα response gene set (C) and hallmark IFNγ response gene set (D) resulting from the comparison of genes preranked based on logFC values in T−/− KO cells vs. WT (upper plot) and R−/− KO cells vs. WT (lower plot) in astrocytes. The top part of each plot shows the enrichment score representing the running-sum statistic calculated by walking down the ranked list of genes. The middle part shows the position of a member of the gene set in the ranked list of genes. The bottom part depicts the ranking metric that measures a gene’s correlation with the biological function. (E and F) Heatmaps depicting the expression levels of genes belonging to IFNα (E) and IFNγ (F) gene sets upregulated in T−/− cells and R−/− cells. Gene expression, in rows, was row-scaled (z-scores) for visualization. The color scale differentiates values as high (red), medium (yellow), and low (blue) expression. (G and H) Violin plots showing the distribution of IFN score (G) and the inflammation score (H) in T−/− and R−/− KO cells in astrocytes measured from the RNA-seq expression data of 32 IFN-RGs and 30 IRGs, respectively, compared with WT. (Wilcoxon rank-sum test; *, P < 0.05; **, P < 0.01; ****, P < 0.0001.) (I and J) Violin plots showing the IFN score (I) and inflammation score (J) measured in T−/− and R−/− KO cells from qRT-PCR quantification of the median FC of six ISGs and six IRGs, respectively. (n = 5 independent experiments; Wilcoxon rank-sum test; ***, P < 0.001; ****, P < 0.0001.) (K) Heatmap showing the expression level of genes belonging to the NLRP3 inflammasome. Gene expression, in rows, was row-scaled (z-scores) for visualization. (L and M) Violin plots showing the distribution of IFN scores calculated from the median FC of six ISGs in T−/− and R−/− KO cells treated with the STING inhibitor H151 (L) or NLRP3 inhibitor MCC950 (M). (n = 3 independent experiments; Wilcoxon rank-sum test; *, P < 0.05; **, P < 0.01.)

