Figure 3.
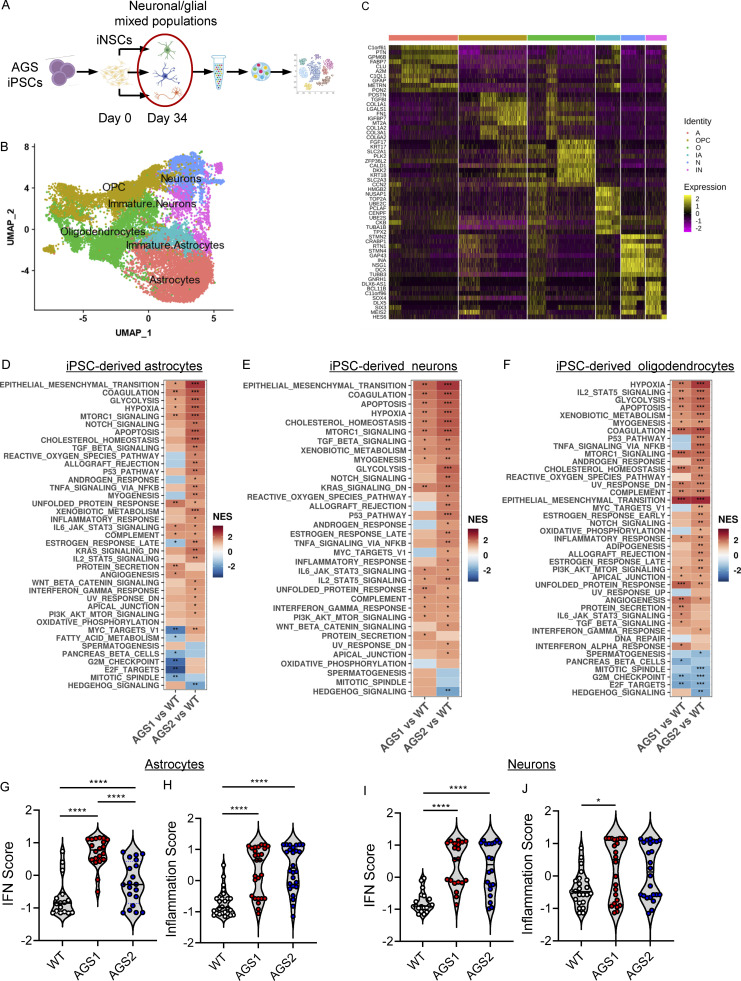
Single-cell transcriptomics reveals AGS phenotypes in patient-derived neuronal/glial mixed populations. (A) scRNA-seq experimental scheme (created with BioRender.com) performed with iPSC-derived cells from patients harboring mutations in TREX1 (AGS1) or RNASEH2B (AGS2). (B) UMAP plot of single-cell data with Seurat. Cells are clustered in two dimensions using the UMAP dimensionality reduction technique and annotated by cell type. (C) Hierarchically clustered average gene expression heatmap for genes overexpressed across the different cell types grouped according to the Seurat classification (A, astrocytes; IA, immature astrocytes; IN, immature neurons; N, neurons; O, oligodendrocytes; OPC, oligodendrocyte precursor cells). Yellow, high expression; purple, low expression. Scaled-in normalized gene expression data are shown. (D–F) Heatmap visualizing the enriched GSEA terms in astrocytes (D), neurons (E), and oligodendrocytes (F) against the Hallmark gene set (Molecular Signatures Database). GSEA was performed on logFC preranked gene lists obtained from AGS1 and AGS2 gene expression compared with WT within each cell type. (NES, normalized enrichement score; *, adjusted P < 0.05; **, adjusted P < 0.01; ***, adjusted P < 0.001.) (G–J) Violin plots showing the distribution of IFN scores and inflammation scores in astrocytes (G and H) and neurons (I and J) calculated from the expression of 32 IFN-RGs and 30 IRGs, respectively, in AGS1 and AGS2 patients compared with WT. (Wilcoxon rank-sum test; *, P < 0.05; ****, P < 0.0001.)

