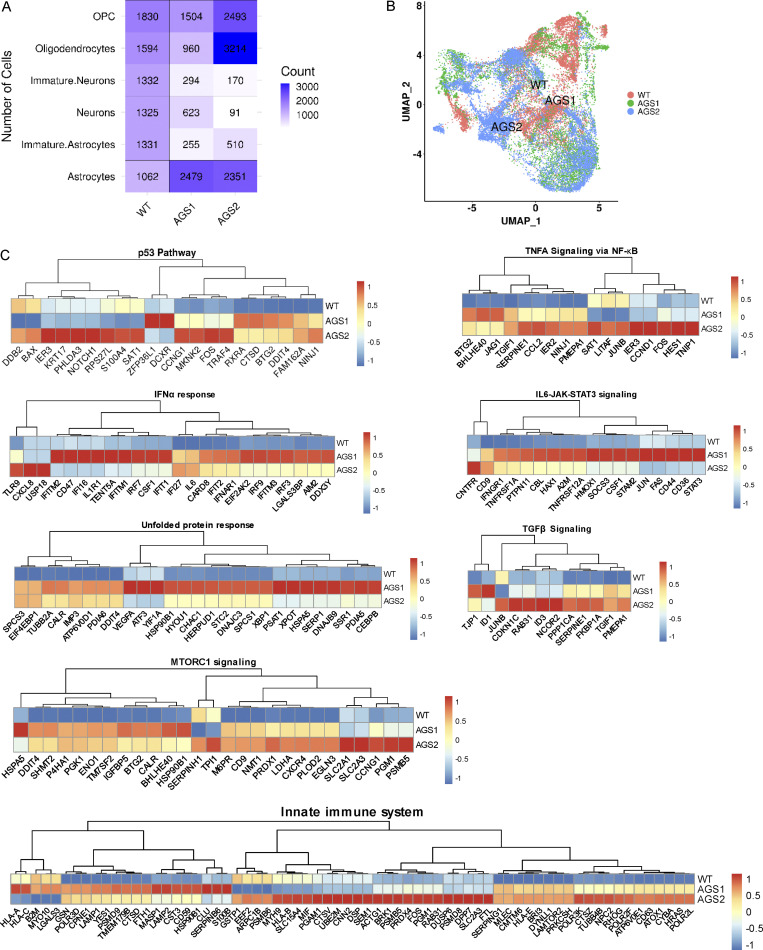
Figure S3.
Spontaneous activation of multiple inflammatory pathways identified by scRNA-seq in AGS patient–derived astrocytes. (A) Number of cells quantified from single-cell data by CellRanger in the different cell type clusters across the studied samples. (B) UMAP plot showing the clustering of cells across samples with Seurat. Cells are clustered in two dimensions using the UMAP dimensionality reduction technique and annotated by sample type. (C) Heatmaps depicting the expression of genes from the GSEA terms identified from the different comparisons between AGS1 and AGS2 iPSC-derived astrocytes compared with WT. Gene expression, in rows, was row-scaled (z-scores) for visualization. The color scale differentiates values as high (red), medium (yellow), and low (blue) expression.

