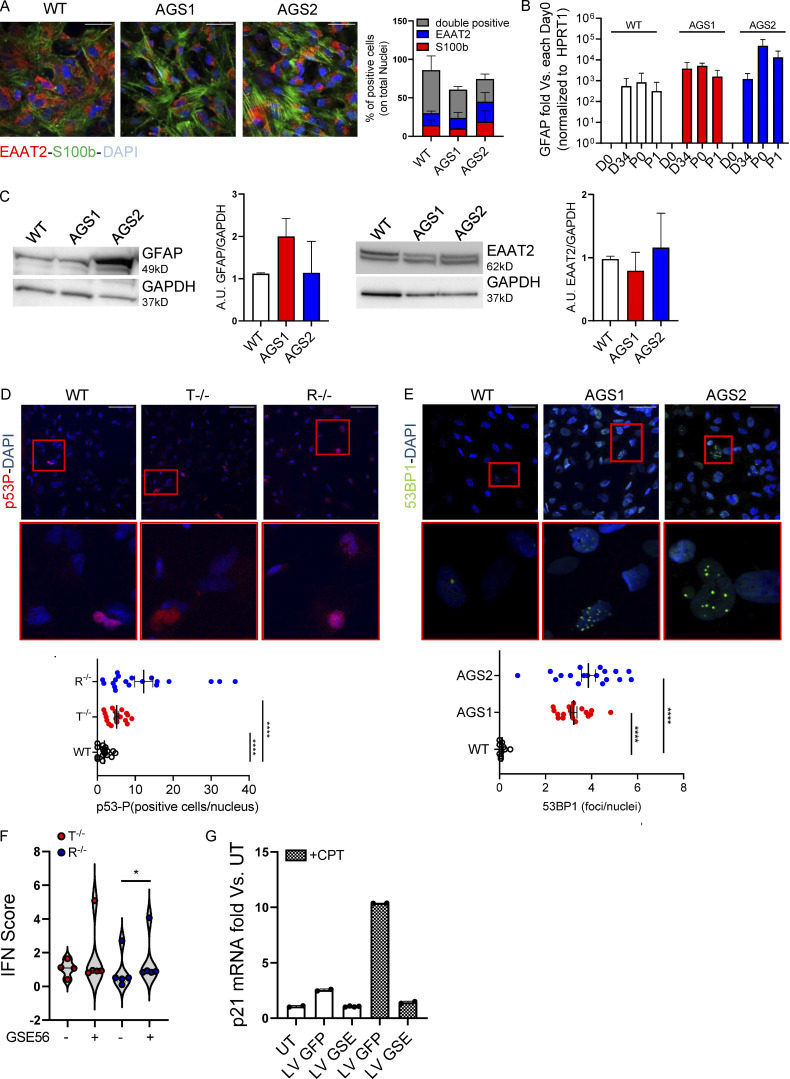
Figure S4.
AGS patient–derived and KO iPSCs efficiently differentiate into proinflammatory astrocytes and spontaneously activate DNA damage responses. iPSC-derived proinflammatory astrocytes from healthy control (WT) or patients harboring mutations in TREX1 (AGS1) or RNASEH2B (AGS2) were analyzed. (A) Percentages of S100b- and EAAT2-expressing and double-positive cells were measured by IF and quantified. One representative image per genotype is shown. Five fields from three slides of two independent differentiation experiments were acquired. Scale bar, 50 µm. (Mean ± SEM; n = 2 independent experiments.) (B) GFAP astrocyte marker was detected by gene expression in AGS patient–derived clones and WT at passage 1 after the iPSC-derived astrocyte enrichment step and expressed as fold difference vs. day 0, normalized on HPRT1 housekeeping gene. (Mean ± SEM; n = 3 independent experiments.) (C) Expression and ImageJ quantification of the astrocyte markers EAAT2 and GFAP by WB. One representative gel is shown. (Mean ± SEM; n = 3 independent experiments.) (D) IF of WT and KO iPSC–derived proinflammatory astrocytes stained for phosphorylated p53, quantified by measuring area intensity normalized on number of nuclei. Each dot corresponds to one field from three slides of four independent differentiations. Scale bar, 50 µm. (Mean ± SEM; n = 4 independent experiments; one-tailed Mann–Whitney U test; ****, P < 0.0001.) (E) IF of AGS patient–derived iPSC-derived proinflammatory astrocytes stained for 53BP1, quantified by cell profiler. Each dot corresponds to one field from three slides of three independent differentiations. (Mean ± SEM; n = 3 independent experiments; one-tailed Mann–Whitney U test; ****, P < 0.0001.) Scale bar, 50 µm. (F) Violin plot showing the distribution of IFN scores calculated from the median FC of six ISGs in T−/− and R−/− KO cells transduced with a lentiviral vector expressing GSE56. (n = 2 independent experiments; Wilcoxon rank-sum test; *, P < 0.05.) (G) p21 mRNA levels were detected by gene expression in astrocytes upon transduction with lentiviral vector expressing GFP (LV GFP) or GSE (LV GSE56) in the presence or not of Camptothecin (CPT), a topoisomerase inhibitor. Data are expressed as fold vs. untransduced cells (UT) and normalized to HPRT1 housekeeping gene. (Mean ± SD; n = 2 technical replicates.) Source data are available for this figure: SourceDataFS4.

