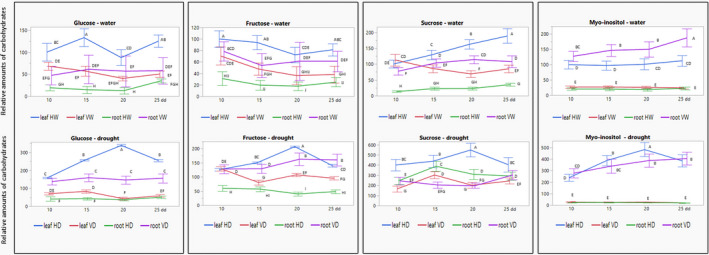
FIGURE 5.

Glucose, fructose, sucrose, and myo‐inositol in tomatoes not infected (H) and infected (V), watered and subjected to drought: reallocation from leaves to roots on infection. Leaf and root samples were collected after 10, 15, 20, and 25 days of drought application (dd). HW, not infected (healthy) and watered; HD, not infected and subjected to drought; VW, infected and watered; VD, infected and subjected to drought. The amount of each carbohydrate in leaves of HW was considered to be 100 on the first day of sampling (10 dd); the amounts of each carbohydrate were calculated relative to this value. Bars represent the standard deviation of the carbohydrate levels from three independent biological repeats. Different uppercase letters (A–I) above the bars denote significant differences (Tukey HSD, p < 0.05, which was done for results obtained from watered and drought‐treated plants separately)
