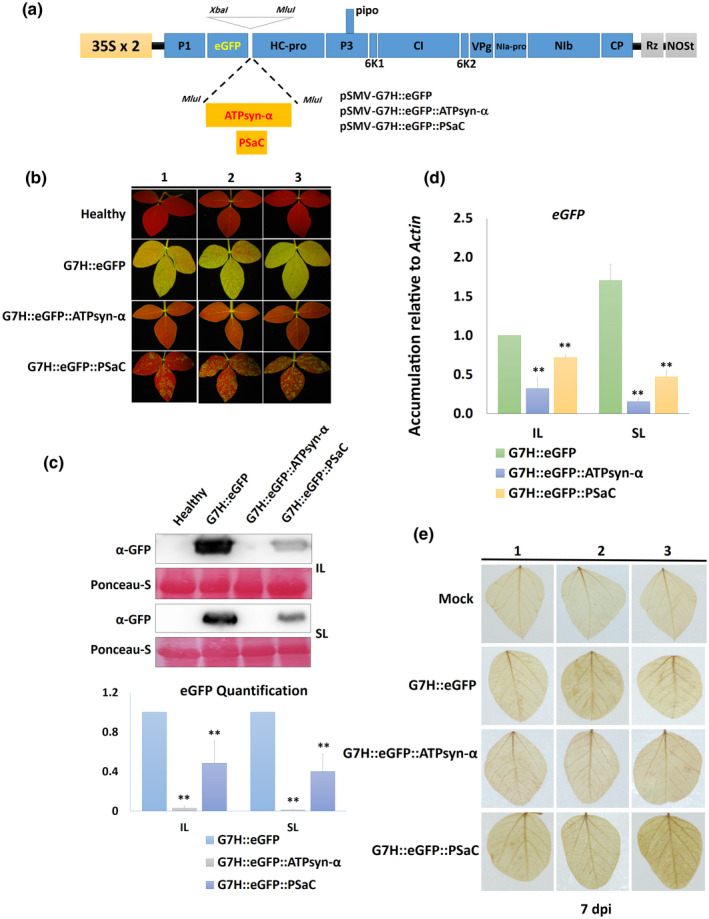
FIGURE 4.

Effect of overexpressing ATPsyn‐α and PSaC on resistance against G7H in the susceptible cultivar Lee74. (a) Schematic drawing of pSMV‐G7H::eGFP construct with the insertion site for ATPsyn‐α and PSaC downstream of the GFP coding sequence; the expression of the construct is driven by two copies of the CaMV 35S promoter (35S × 2) and is terminated by an NOS terminator (NOSt). Rz is a cis‐cleaving ribozyme sequence. (b) Green fluorescent protein (GFP) visual levels in the systemically infected leaves (SL) of Lee74 plants. The first unifoliate leaves of 12‐day‐old seedlings were infected with pSMV‐G7H::eGFP, pSMV‐G7H::eGFP::ATPsyn‐α, or pSMV‐G7H::eGFP::PSaC. Fourteen days later, the SL from three plants (1, 2, and 3) were photographed under UV light. (c) Western protein blot for GFP levels (upper panel) in the inoculated leaves (IL) and the SL, and their quantified levels (lower panel). Ponceau S staining of RuBisCO was used on the loading control. (d) Relative expression levels of GFP RNA in IL and SL of Lee74 infected with pSMV‐G7H::eGFP constructs. Actin11 was used as the internal control. Values are means + SD of three biological replicates. Statistical analysis was carried out as described in the legend of Figure 1; ** indicates a significant difference at p < 0.01. (e) Detection of reactive oxygen species in Lee74 as indicated by 3,3′‐dimainobenzidine staining at 7 days postinoculation (dpi)
