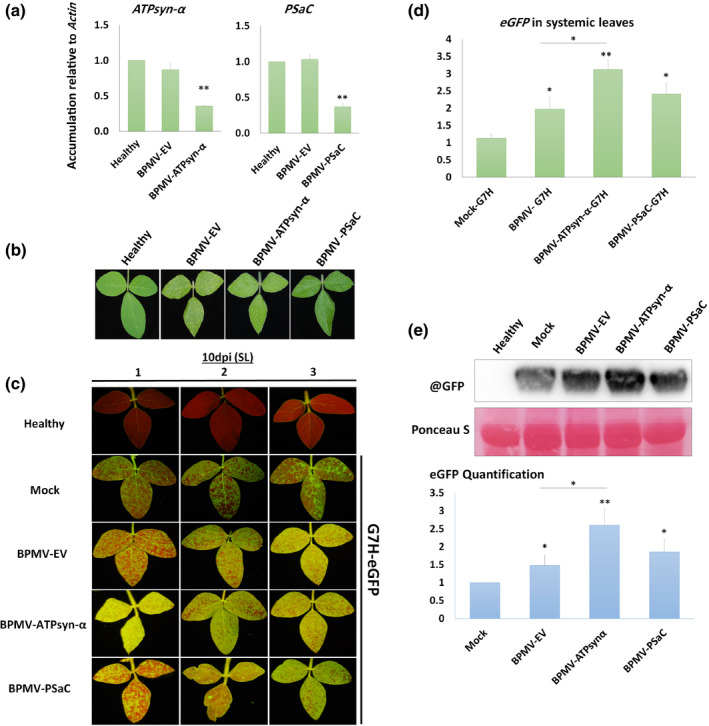
FIGURE 5.

Effect of silencing GmATPsyn‐α and GmPSaC on soybean susceptibility to SMV‐G7H infection. Lee74 plants were silenced in GmATPsyn‐α and GmPSaC using BPMV silencing vector. (a) Relative expression levels of ATPsyn‐α (left) and PSaC (right) in the upper systemic leaves of Lee74 plants 14 days after BPMV infection in the empty vector (BPMV‐EV), ATPsyn‐α‐silenced (BPMV‐ATPsyn‐α), and PSaC‐silenced plants (BPMV‐PSaC). Healthy plants were used as negative control. Actin was used as internal control. Values are means + SD of three biological replicates. Statistical analysis was carried out as described in the legend of Figure 1; ** indicates a significant difference at p < 0.01. (b) Mottling symptoms developed in silenced Lee74 plants compared to BPMV‐EV control or healthy plants. (c) Green fluorescent protein (GFP) fluorescence from the upper systemic leaves of silenced plants infected with pSMV‐G7H::eGFP at 10 days postinoculation (dpi). Mock plants were treated with phosphate buffer as a control for BPMV infection. (d) Relative expression levels of eGFP in the Lee74 systemically infected leaves with pSMV‐G7H::eGFP at 10 dpi. Healthy plants were used as negative control. Actin was used as internal control. Values are means + SD of three biological replicates. Statistical analysis was carried out as described in the legend of Figure 1; significant difference at *p < 0.05, **p < 0.01. (e) Protein blot of GFP levels (upper panel) in the Lee74 systemically infected leaves with pSMV‐G7H::e GFP at 10 dpi, and their quantified levels (lower panel). Ponceau S staining of RuBisCO was used on the loading control. The blot is a representative of three biological replicates with similar results
