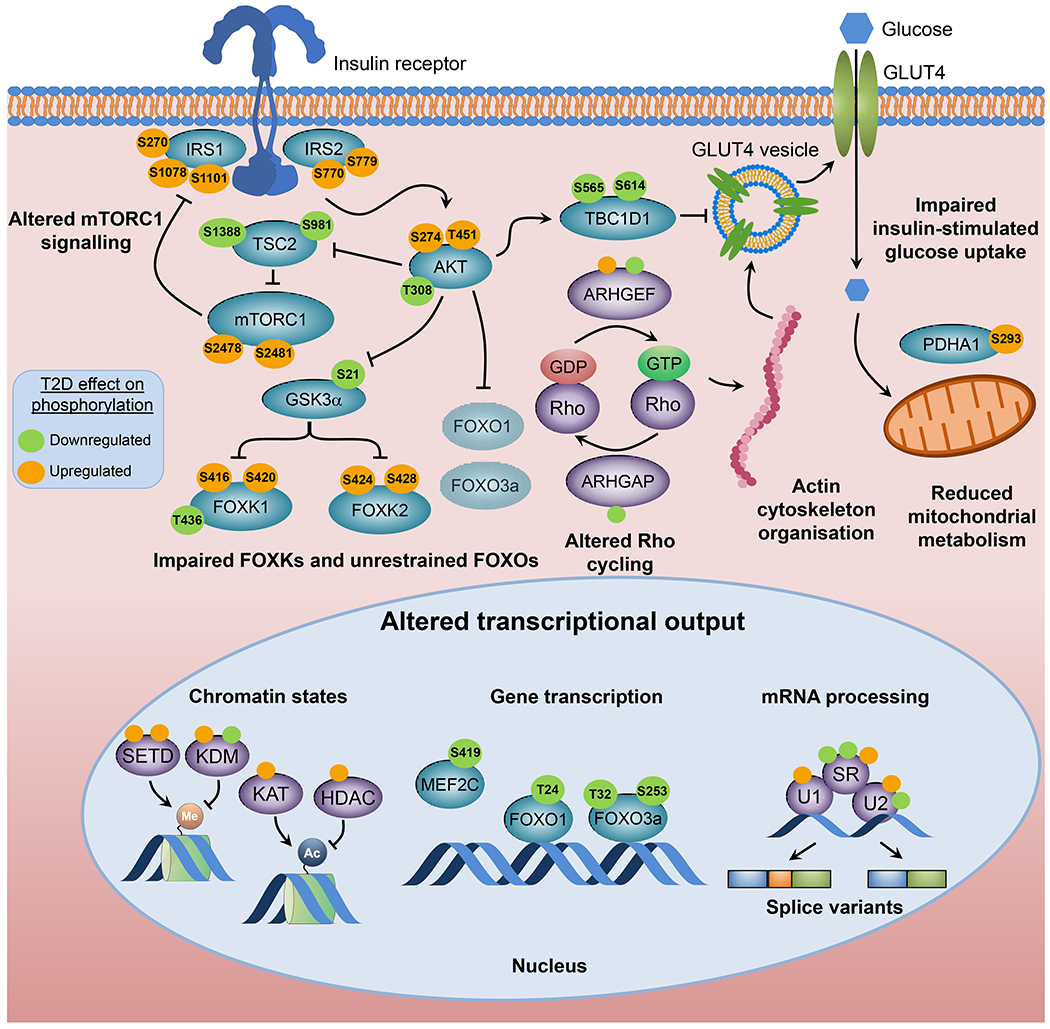
Fig. 4.

Intrinsic factors contributing to insulin resistance. Cell-autonomous insulin resistance is associated with defects in glucose transport, mitochondrial metabolism and insulin signalling. Global phosphoproteomics of iMyos from individuals with type 2 diabetes reveal a network of signalling defects that underlie skeletal muscle insulin resistance [100]. Proteins linked to insulin action and metabolism are indicated in blue and site-specific effects of type 2 diabetes evidenced by increased and decreased basal phosphorylation are shown in orange and green, respectively. Groups of multiple proteins of the same category are shown in purple and non-labelled circles indicate groups of up- or downregulated phosphosites. All signalling events are derived from MS-based phosphoproteomics except for AktT308, GSK3αS21 and FOXO1T24/FOXO3T32, which are from immunoblot analysis. Faded shading of text boxes indicates lower cytoplasm abundance. Ac, acetyl group; ARHGAP, Rho GTPase activating protein; ARHGEF, Rho guanine nucleotide exchange factor; HDAC, histone deacetylase; KAT, lysine acetyltransferase; KDM, lysine demethylase; Me, methyl group; MEF2C, myocyte enhancer factor 2C; PDHA1, pyruvate dehydrogenase E1 subunit alpha 1; SETD, SET domain containing histone lysine methyltransferase; SR, serine- and arginine-rich splicing factor; T2D, type 2 diabetes; TBC1D1, TBC1 domain family member 1; TSC2, tuberous sclerosis 2; U1, U1 small nuclear ribonucleoprotein complex; U2, U2 small nuclear ribonucleoprotein complex. This figure is available as part of a downloadable slideset.
