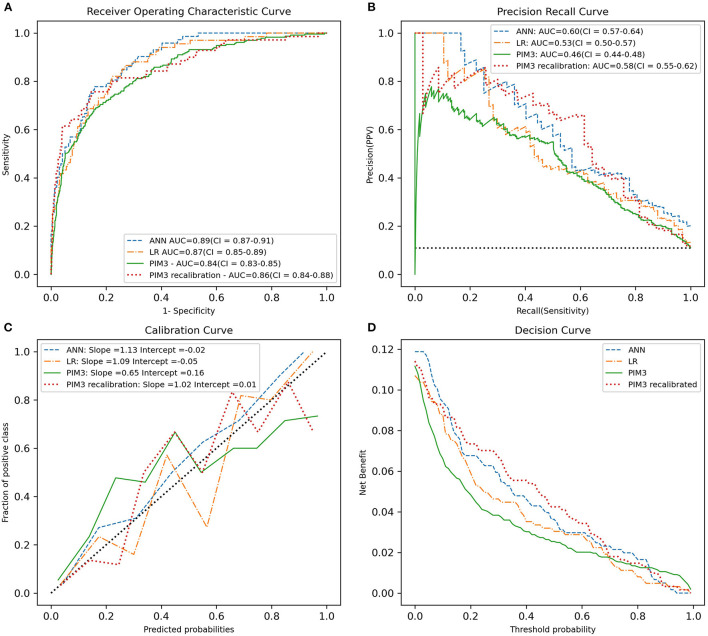
Figure 1.
Predictive performance of the ANN, LR, recalibrated PIM3 and original PIM3 models. (A) The ROC curve. (B) The precision-recall curve. (C) The calibration cure. (D) The decision curve. The area under the curve in A and B and the slope of the calibration curve in C are shown in the legend. PIM3 performance metrics were calculated across the whole data set, while the ANN and LR performance metrics were calculated on the test set.

