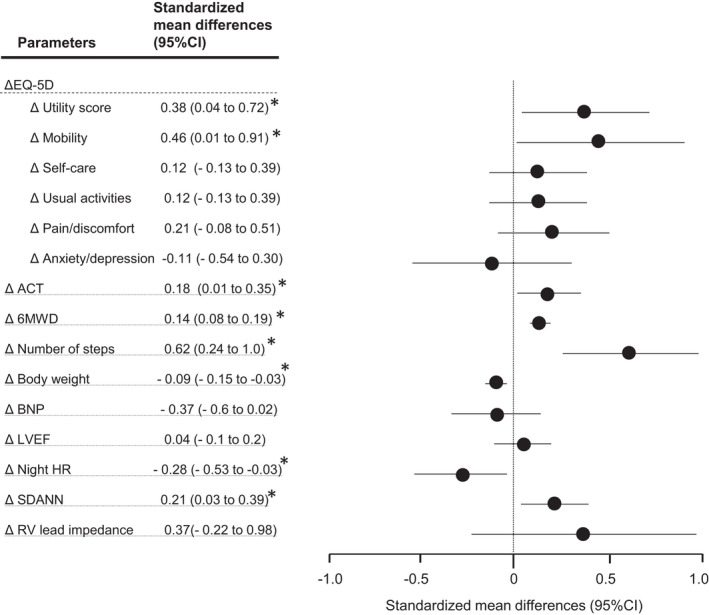
FIGURE 2.

Standardized mean differences in the outcome parameters at the 3‐month follow‐up. The Hedges’ g and 95% confidence intervals are shown. A standardized mean difference of 0.20 was considered a small difference between the groups; 0.50, a moderate difference; and 0.80, a large difference. * p < .05. The abbreviations are as in Table 1
