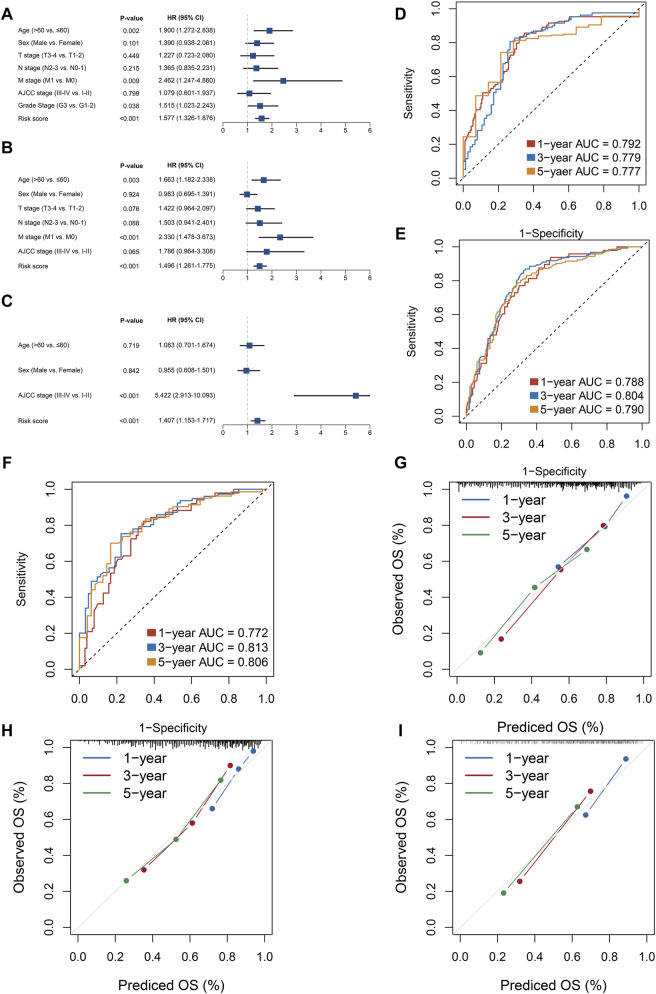
FIGURE 3.
Evaluation of the PPSM model effectiveness in three cohorts. (A–C) Multivariate COX regression analysis of the risk score in the three cohorts: TCGA (A), GSE62254 (B), and GSE15458 (C). (D–F) ROC analysis for the three cohorts: TCGA (D), GSE62254 (E), and GSE15458 (F). (G–I) Calibration plots were used to compare the actual probabilities and the predicted probabilities of OS in the three cohorts: TCGA (G), GSE62254 (H), and GSE15458 (I).

