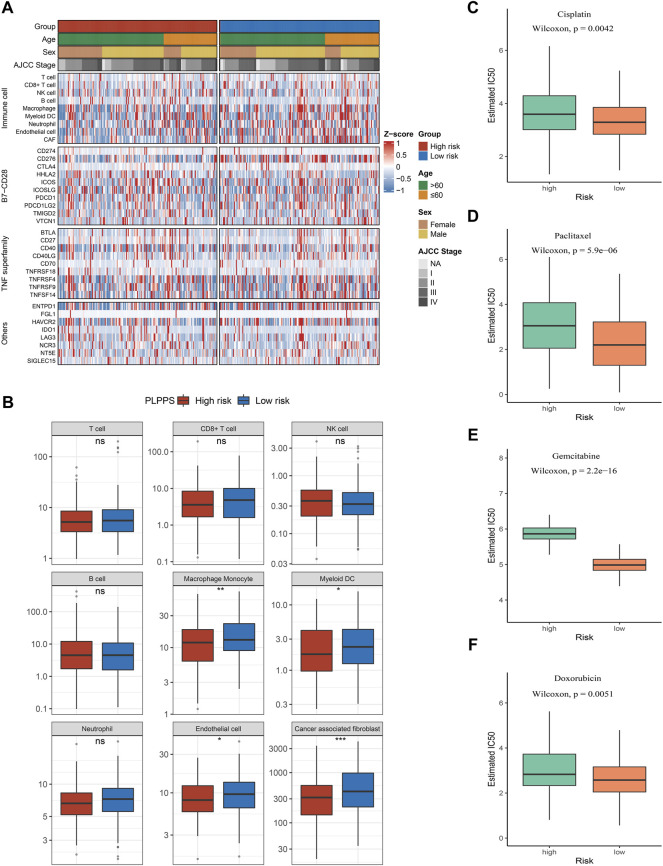
FIGURE 6.
Immune infiltration analysis and prediction of chemotherapy response in the two groups. (A) Heatmap for immune analysis among the two subtypes. (B) Boxplots of nine immune cell enrichment levels (C–F). Sensitivity of cisplatin (C), paclitaxel (D), gemcitabine (E), and doxorubicin (F) in the two subtypes.

