Fig 2.
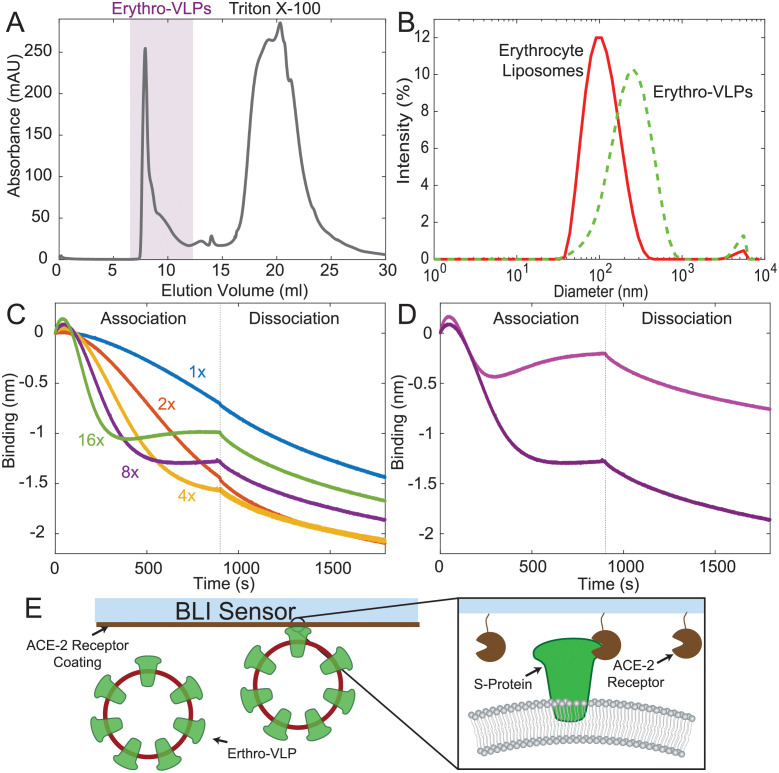
A: Size exclusion chromatogram of the Erythro-VLPs showing two signals from Erythro-VLPs and Triton-X100. B: Size distribution of Erythro-VLPs, as determined by DLS. While erythrocyte liposomes measured 102 nm (polydispersity: 0.19) an average diameter of 222 nm (polydispersity: 0.32) was determined for the S-protein carrying liposomes. C: Binding of Erythro-VLPs to human ACE-2 protein was measured by biolayer interferometry (BLI). A dose-dependent reduction in BLI signal was observed upon exposure of the ACE-2 immobilized biosensors to increasing concentrations of Erythro-VLPs, consistent with the binding of large particles to the optical biosensor. D: Association and dissociation curves for Erythro-VLPs in the absence (light purple) and presence (dark purple) of human ACE-2 immobilized onto the biosensor. The dark purple curve is reproduced from C (8×) for the purpose of comparison. E: Schematic of the BLI. Biotinylated human ACE-2 was immobilized onto the Streptavidin BLI sensor. The sensor was then exposed to Erythro-VLPs and association and dissociation was monitored.

