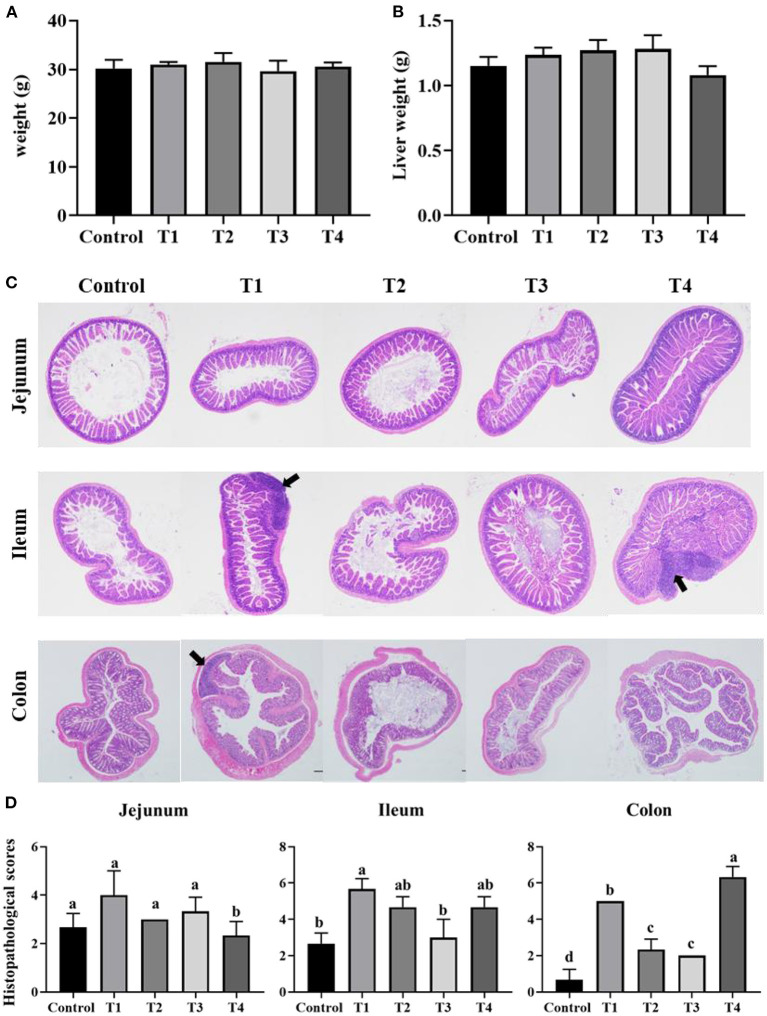
Figure 1.
Bar chart showing the mice body weight (A) and liver weight (B). Representative H&E-stained sections from jejunum, ileum, cecum and colon (C), the arrowhead points in the direction where lymphocyte aggregation. Histopathological scores of the H&E staining (D). Data was expressed as mean ± SEM (n = 8) and analyzed by one-way ANOVA analysis. The different superscript letters on the histogram represent a significant difference (D) (P < 0.01).

