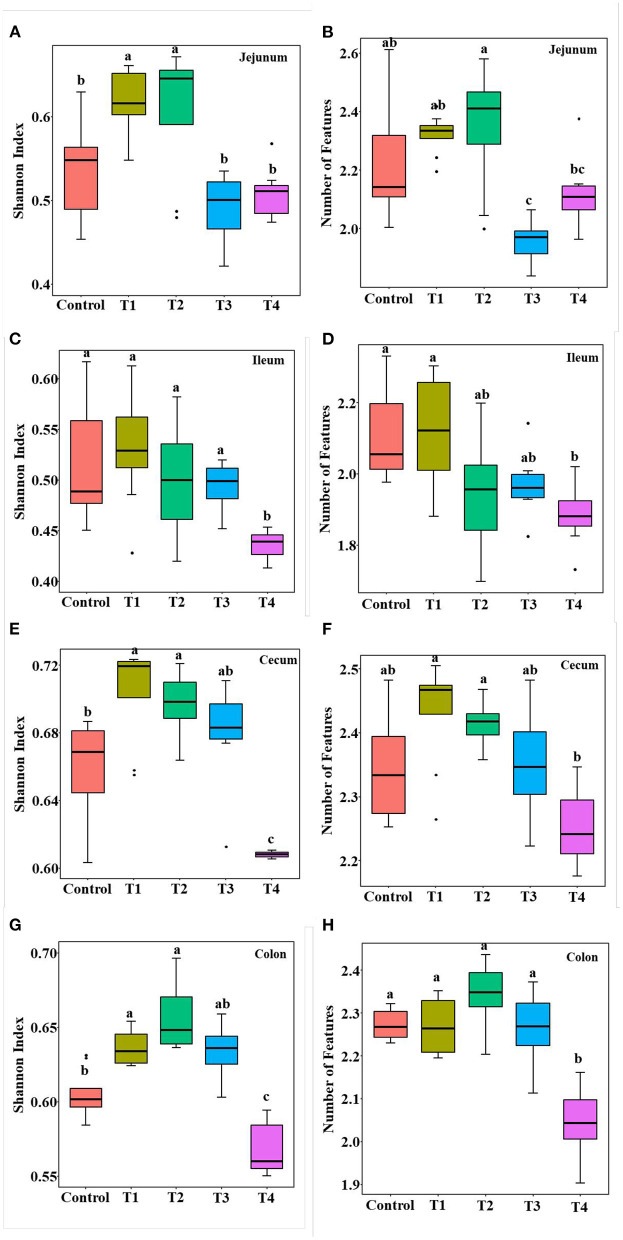
Figure 2.
Alpha diversity including Shannon index (A,C,E,G) and the number of features (B,D,F,H) in control group, Trichlorogalactosucrose (TGS) 1–4 (T1, T2, T3, T4) groups in jejunum (A,B), ileum (C,D), cecum (E,F), colon (G,H). Data was processed through log10, and expressed as mean ± SEM (n = 8) and analyzed by one-way ANOVA analysis. The different superscript letters on the boxplot represent a significant difference (P < 0.01).

