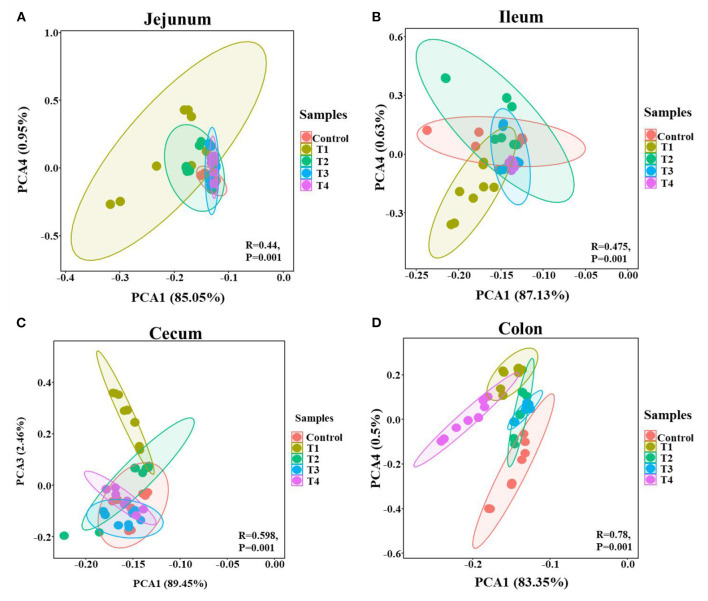
Figure 3.
PCA of the mice gut microbial community composition of the Control and T1-4 group based on the Bray-Curtis distances showed distinct clusters, P-value and R-value were calculated by ANOSIM. The jejunum (A), ileum (B), cecum (C), and colon (D) microbial community structure between the Control group and T1–4 groups were differentiated by colors (red, brown, green, blue, purple, respectively).

