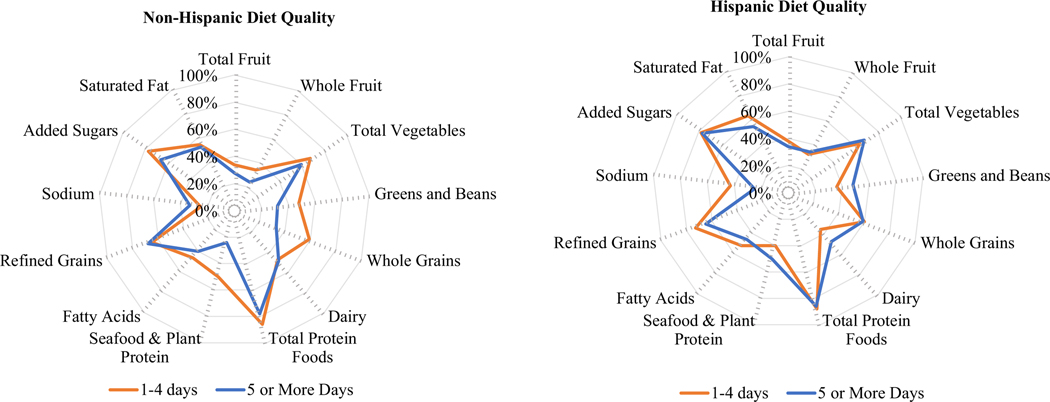
Figure 1. Diet quality component scores stratified by ethnicity and number of days between dietary recall interview and last food pantry visit (within 1–4 days of dietary recall versus 5 or more days).
Each component score is scaled as a percentage of the maximum score of that component, with moderation components reversed coded in the scoring process, meaning a lower percentage in moderation components reflects high intake of that component relative to recommendations. A perfect HEI score (100% in each component) would be represented by the outermost line of the radar plot.

