Figure 3.

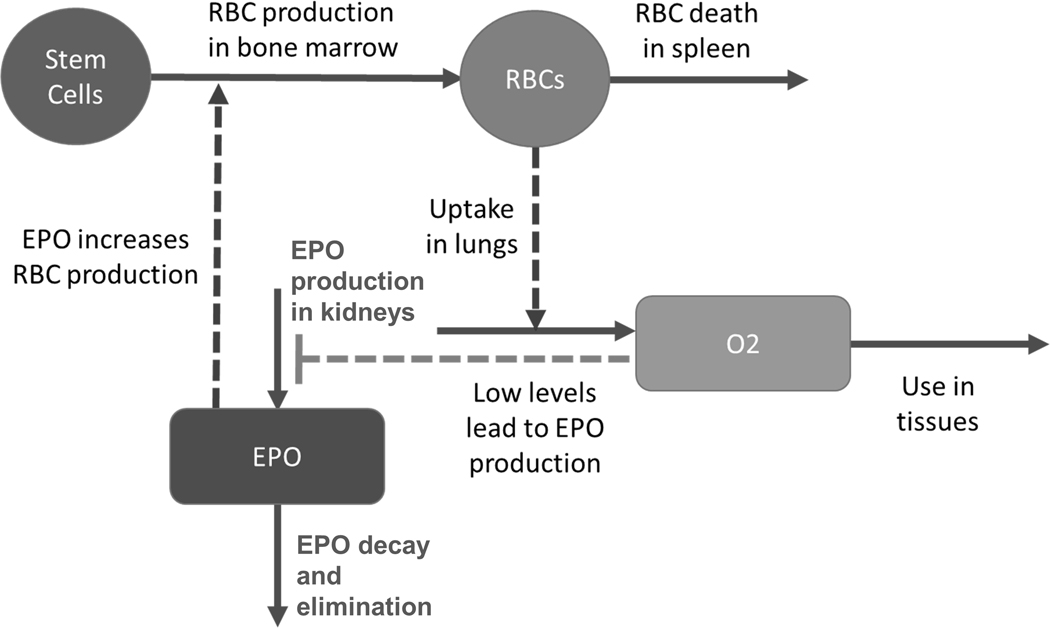
Core structure of a model for exploring homeostasis within the context of RBC regulation. Solid arrows indicate material flow, while dashed arrows represent activating processes and the dashed T-line represents an inhibitory effect.

Core structure of a model for exploring homeostasis within the context of RBC regulation. Solid arrows indicate material flow, while dashed arrows represent activating processes and the dashed T-line represents an inhibitory effect.