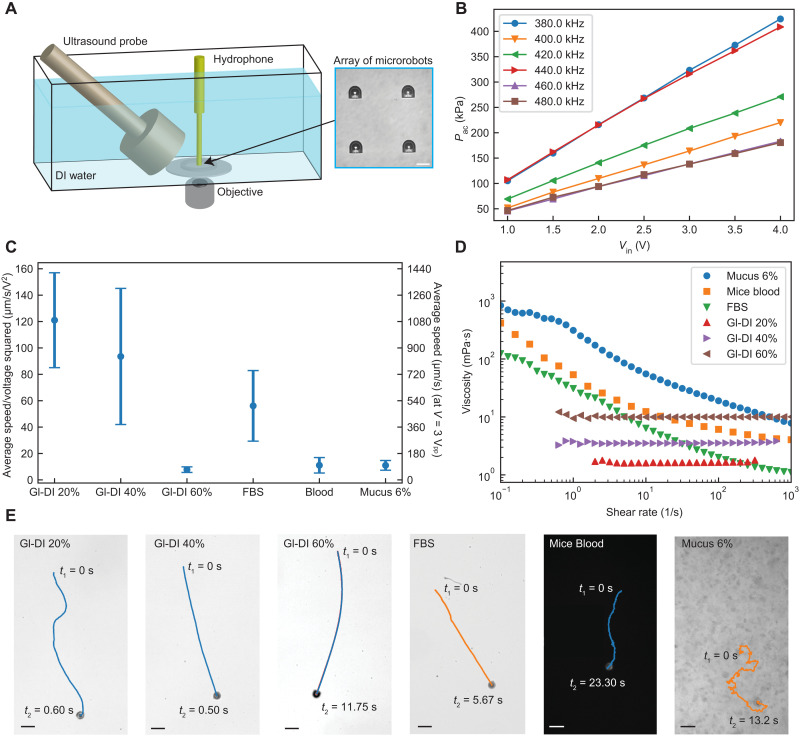
Fig. 2. Characterization of the acoustic microrobot locomotion in Newtonian and non-Newtonian fluids.
(A) The experimental tank setup, where the acoustic pressure was measured using a needle hydrophone close to the microrobots array (inset). Scale bar, 30 μm. (B) The experimentally measured acoustic pressures for different input voltages and excitation frequencies. (C) The average speed of the microrobots in six different fluids is normalized by the input voltage squared. The average values and the error bars were calculated from five independent locomotion tests for each fluid. The second y axis in the diagram gives the average speed value at an input voltage of 3 Vpp. (D) The measured viscosities of six different fluids as a function of the shear rate. (E) The trajectory samples of the microrobots in three Newtonian and three non-Newtonian fluids (movie S1). Scale bars, 50 μm.

