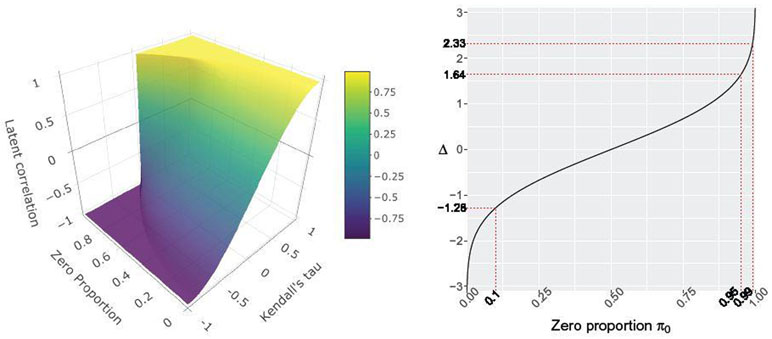
Fig. 1.
(Left) Inverse bridge function 1 F−1(τ, π0) for the continuous/truncated variables pair. The arguments are Kendall’s Τ (x-axis) and the proportion of zeros π0 in the truncated variable (y-axis). The function values correspond to latent correlations (z-axis). (Right) The estimated latent cutoff level Δ versus the proportion of zeros π0 based on the moment equation .

