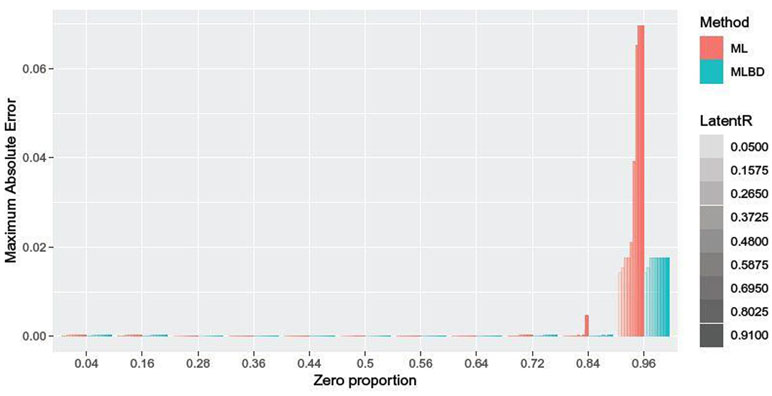
Fig. 3.
TC case. Maximum absolute error of multilinear interpolation approach (ML) and hybrid estimation approach (MLBD) for two simulated variables of sample size n = 100 across 100 replications. One variable is truncated continuous with zero proportion levels from 0.04 to 0.96 (T) and the other variable is continuous (C).

