
Figure 2.
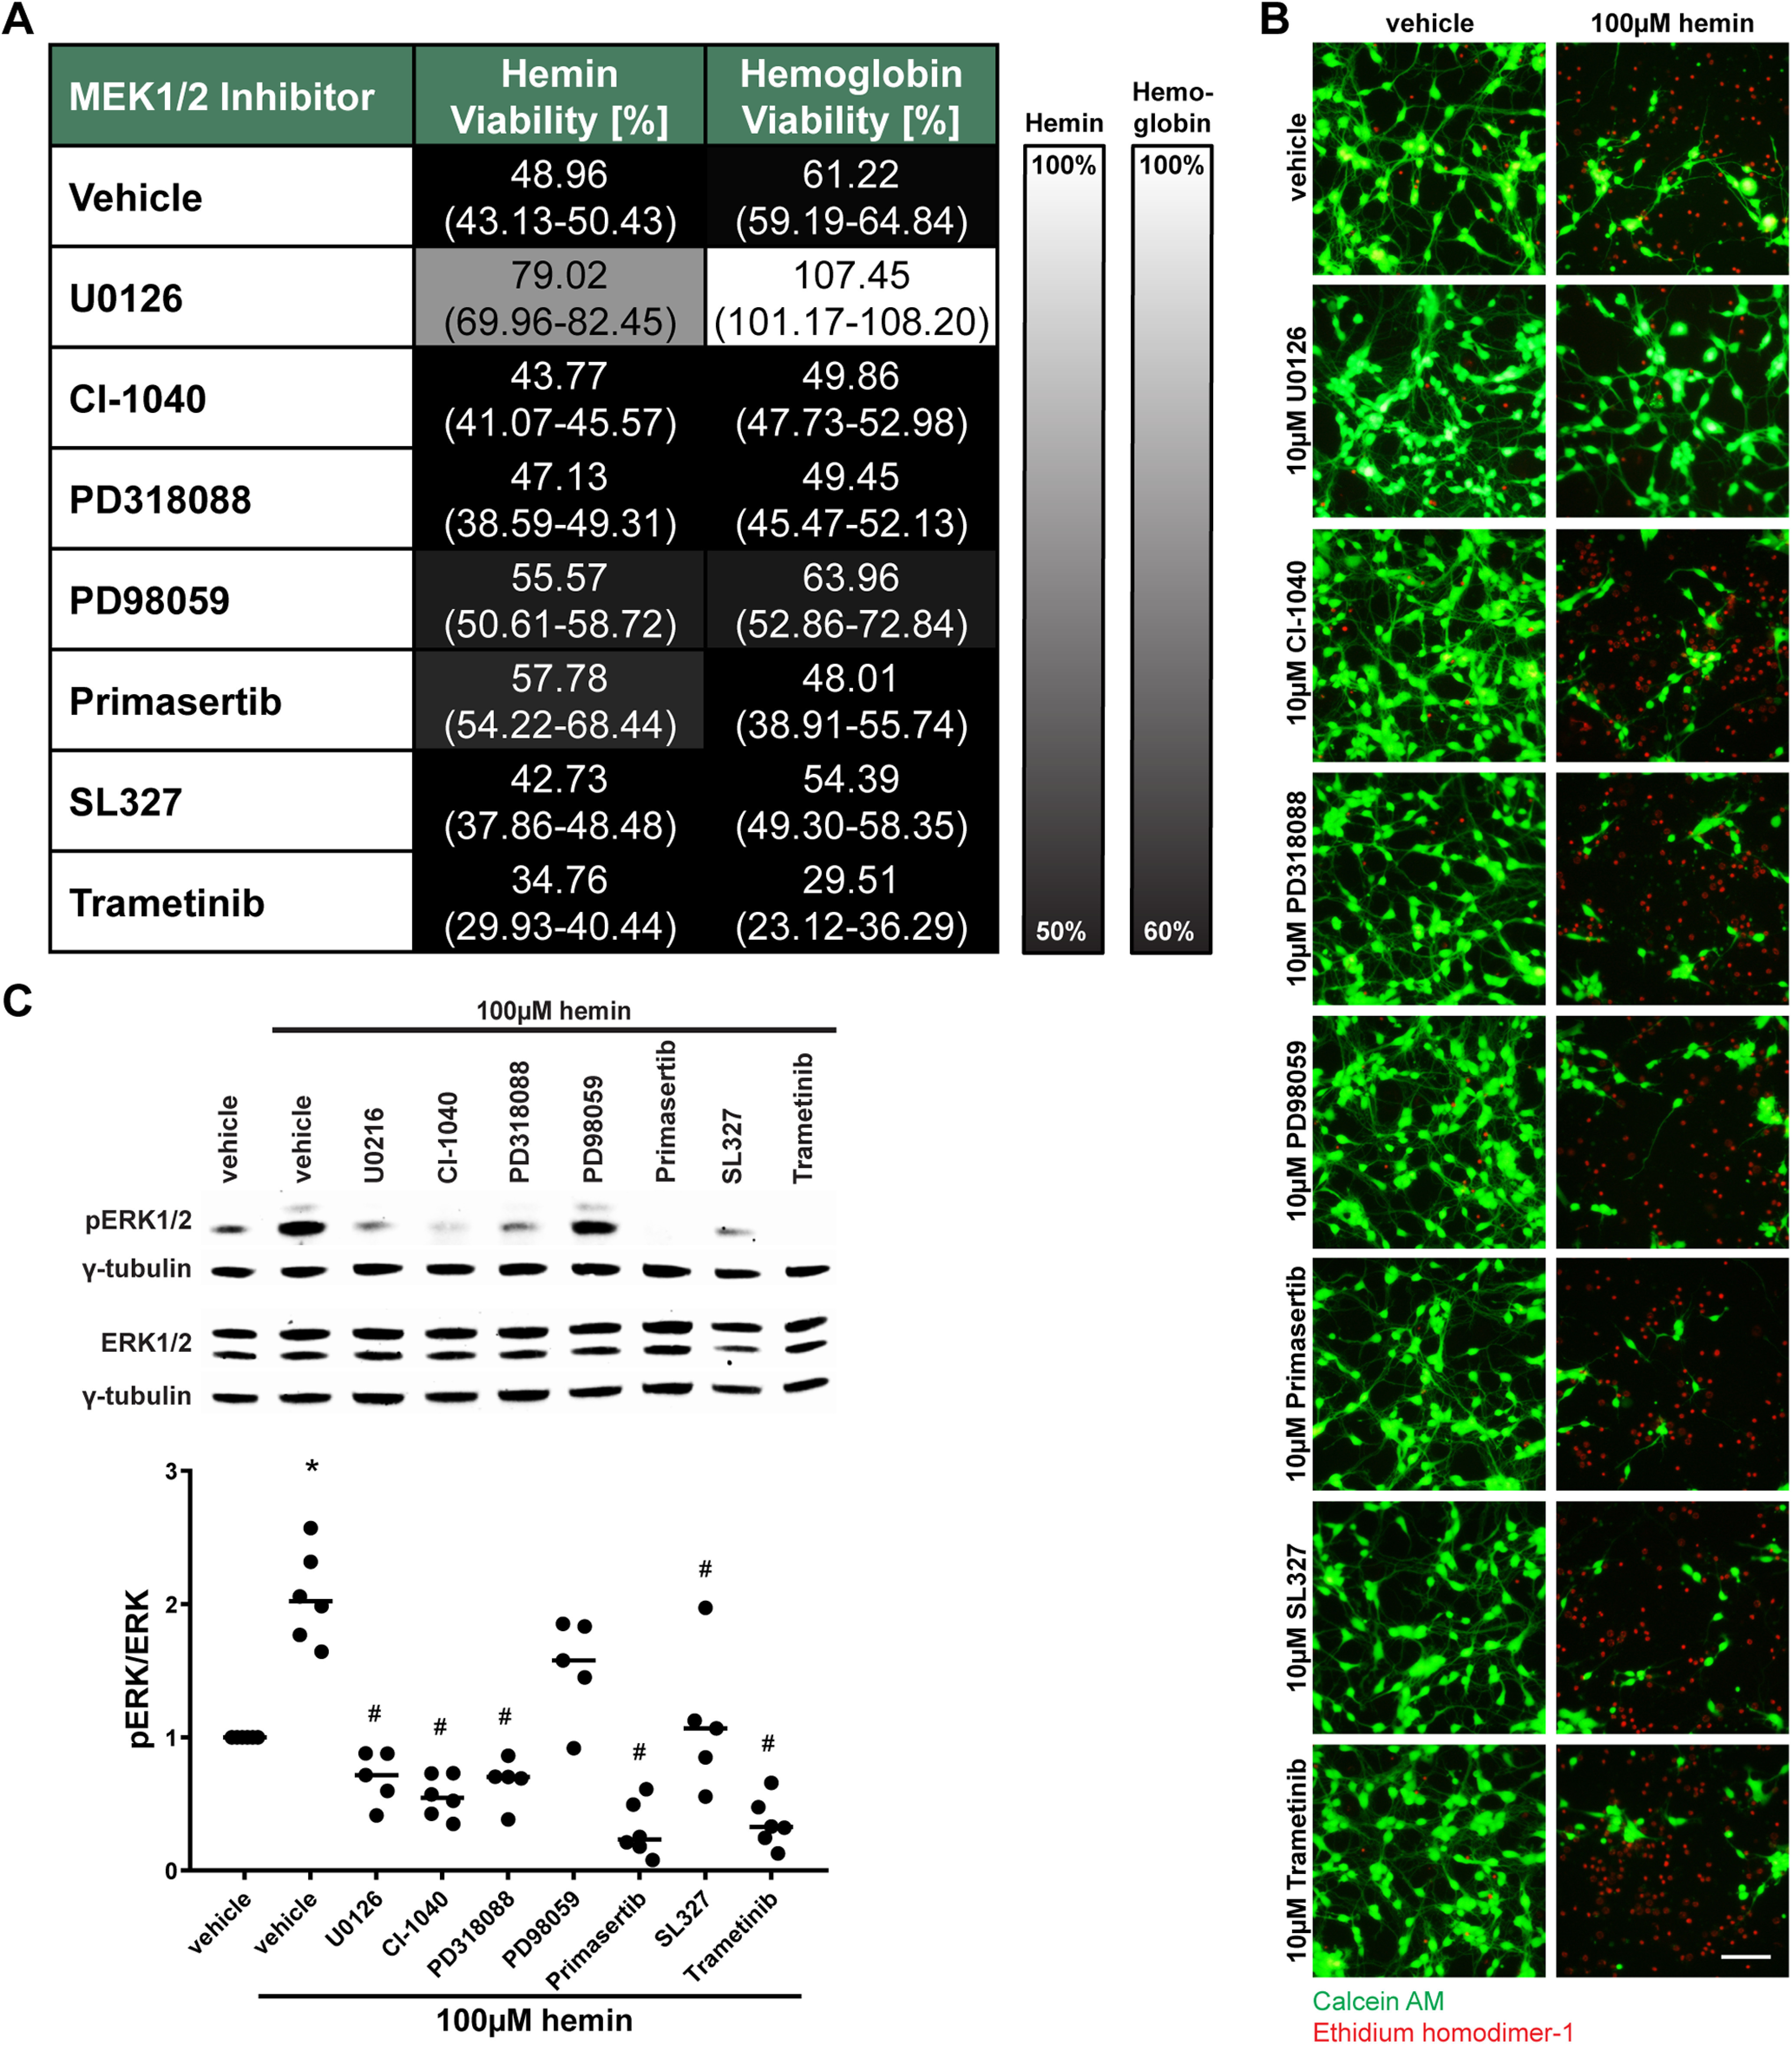
MEK1/2 inhibitors other than U0126 do not protect primary neurons from hemin-induced and hemoglobin-induced neuronal ferroptosis. A, Primary neurons were exposed to 100 μm hemin or 1.5 μm hemoglobin (LD50) and different, structurally diverse MEK1/2 inhibitors. The values reflect the medians (interquartile ranges) at 10 μm of each inhibitor. Grayscale coding reflects a continuum from no protection from hemin or hemoglobin toxicity by a MEK1/2 inhibitor (black) to maximal possible cell viability (white). B, The representative live/dead staining of the inhibitors in hemin-induced neuronal ferroptosis are shown. Scale bar: 100 µm. C, The total and phospho-ERK1/2 protein levels were assessed in primary neurons exposed to hemin and 10 μm different MEK1/2 inhibitors. Medians are given of the ratios of phospho-ERK by total ERK1/2 normalized to γ-tubulin loading control that does not change in response to hemin; *p = 0.017 versus vehicle, #p < 0.05 versus hemin. For exact p values, refer to Extended Data Figure 2-1.