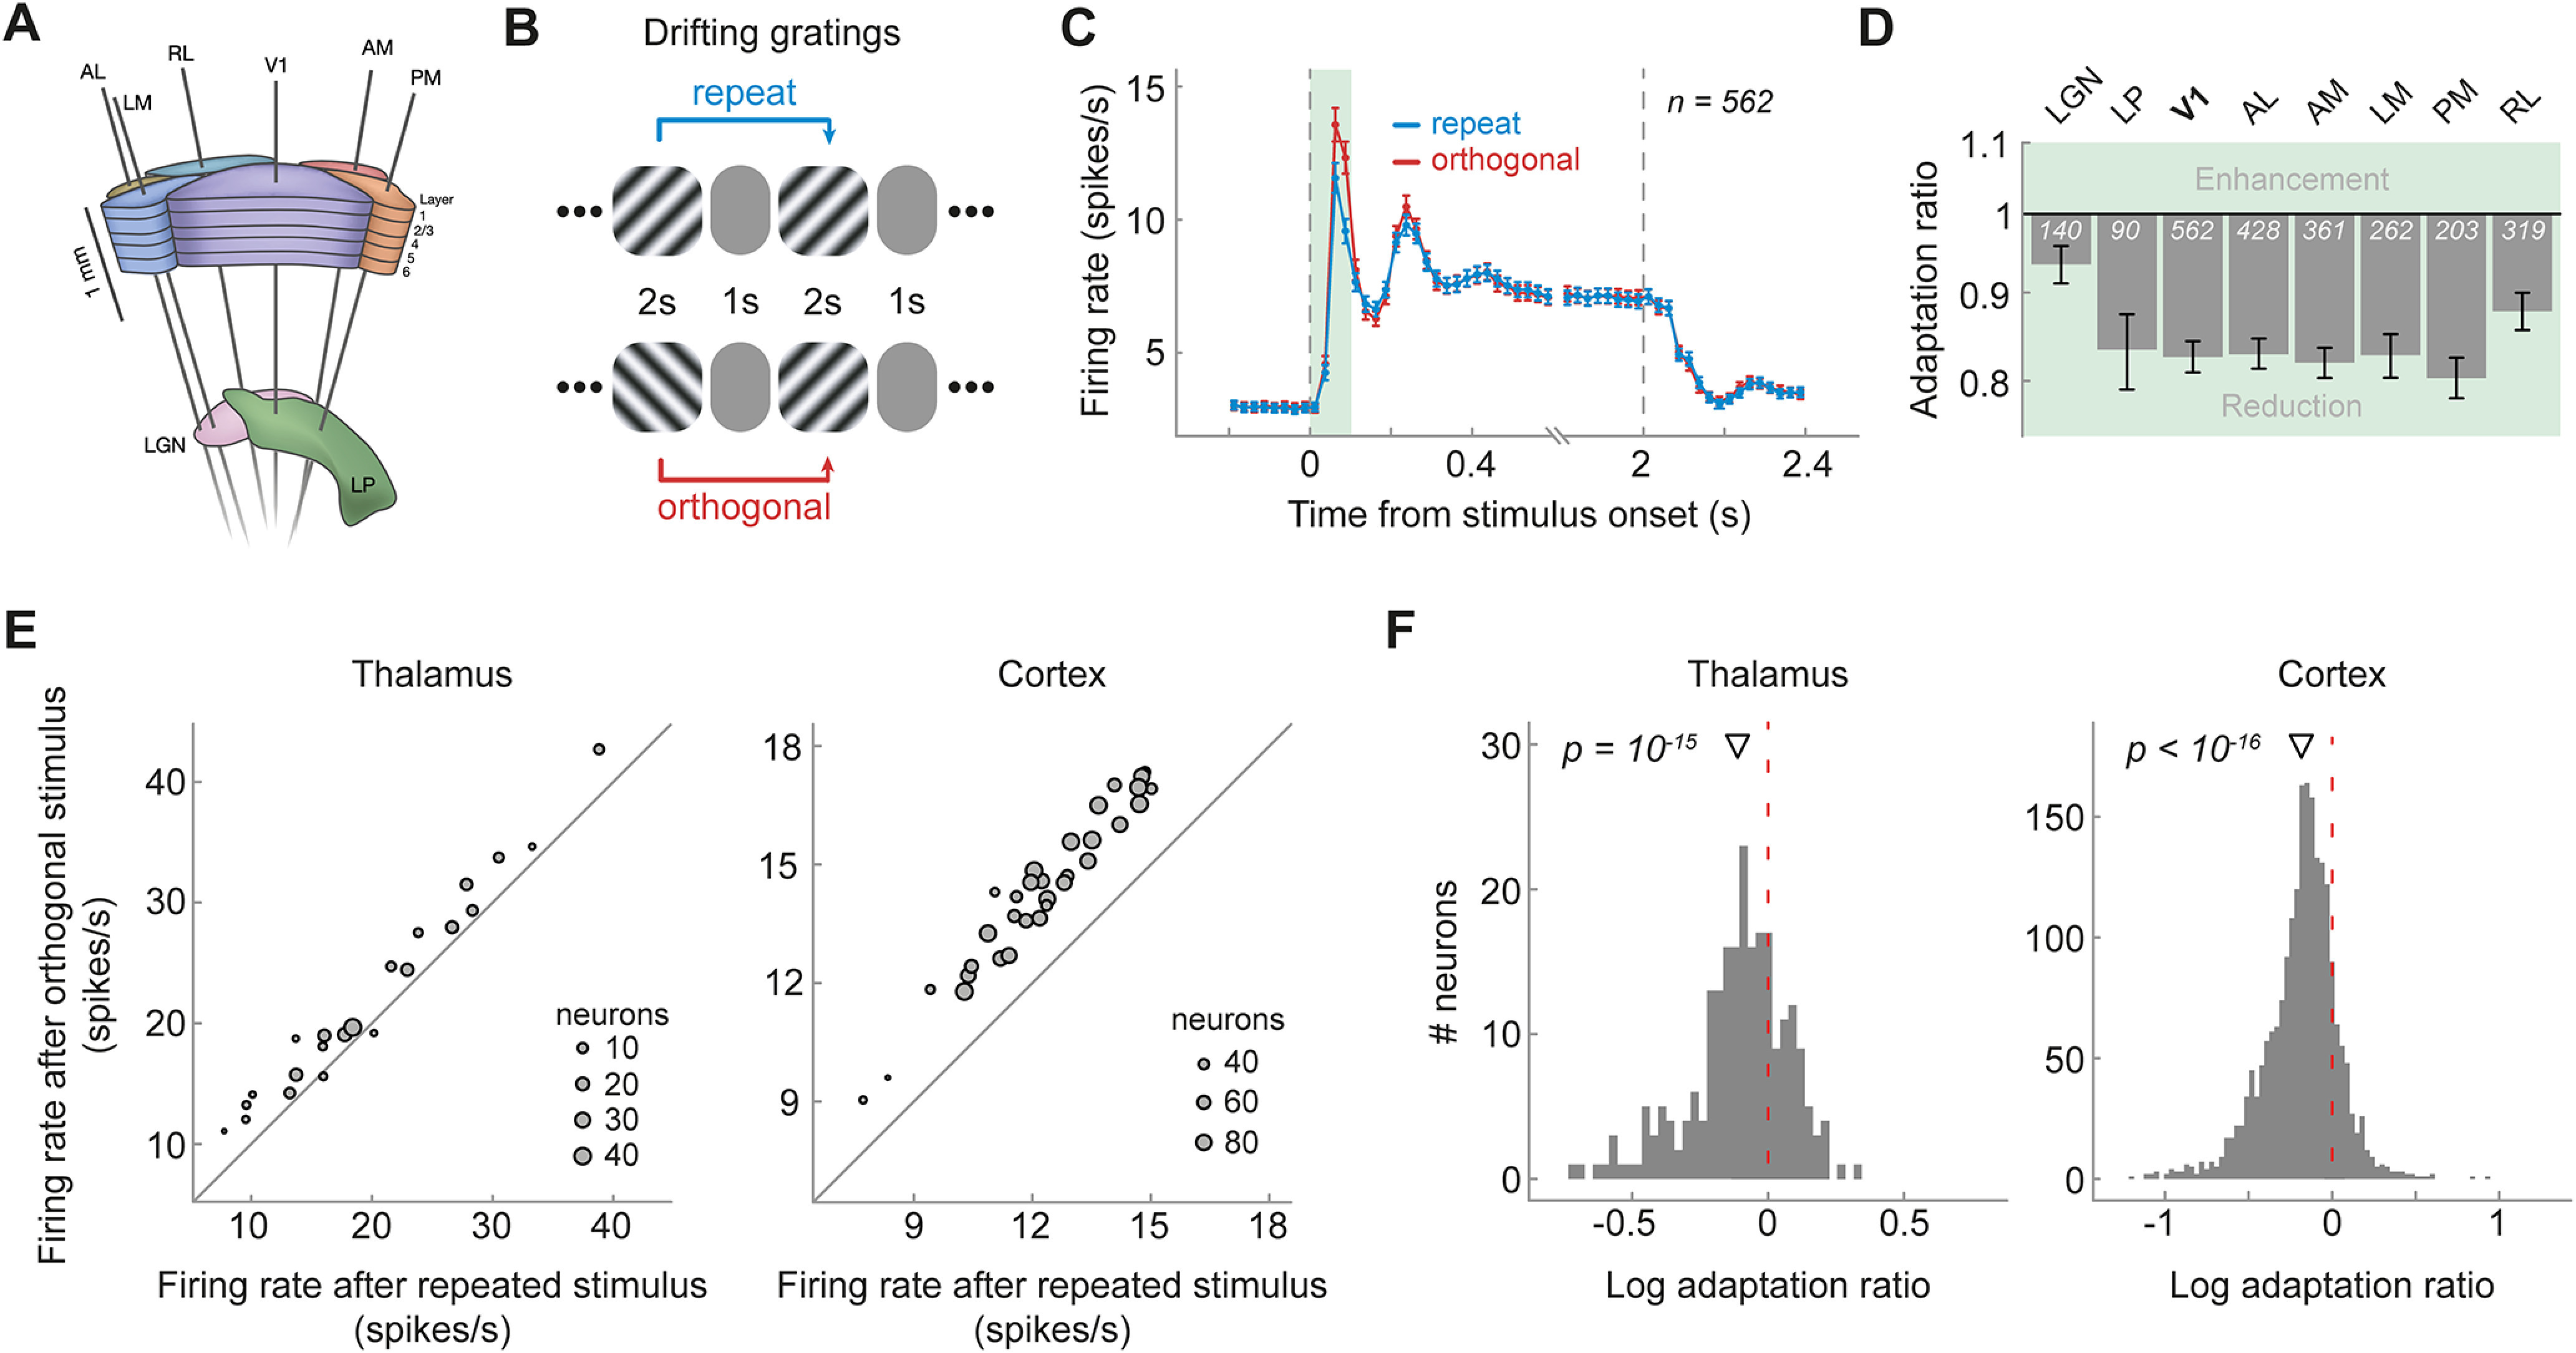
Figure 1.

Visual cortex and thalamus exhibit orientation-specific adaptation to the immediately preceding (1-back) grating. A, Schematic of Neuropixels probe insertion trajectories through visual cortical and thalamic areas, adapted with permission from Siegle et al. (2021). B, Presentation sequence of drifting grating stimuli. Mice were shown drifting gratings with a duration of 2 s, separated by a 1 s gray screen. Gratings were drifting in one of eight different dire ctions (0, 45, 90, 135, 180, 225, 270, 315°) and were presented in random order. For the analysis of orientation-specific adaptation, we contrasted activity to gratings preceded by gratings of the same orientation (repeat, blue) with that elicited by gratings preceded by a grating of the orthogonal orientation (orthogonal, red). C, Population peristimulus time histograms of neurons in V1 for repeat and orthogonal conditions. The transient response is reduced when the same orientation is successively repeated, indicating orientation-specific adaptation. Subsequent analyses focused on this transient response (0–100 ms, green shaded area). Vertical dashed lines denote stimulus onset and offset, respectively. Bin width = 25 ms. Error bars indicate SEM. D, One-back adaptation ratios of transient responses across visual areas. Adaptation ratios were computed by dividing the firing rate of each neuron for repeat by that for orthogonal stimulus presentations and therefore express the response magnitude to a repeated stimulus orientation relative to that elicited by the same stimulus orientation but preceded by a grating with the orthogonal orientation. Adaptation ratios smaller than one indicate adaptation. All visual areas show significant 1-back adaptation. Error bars indicate bootstrapped 95% confidence intervals. White numbers indicate the number of neurons in each area. E, The average firing rate to a stimulus preceded by a stimulus with the same orientation (x-axis) is consistently smaller than the firing rate to a stimulus preceded by a stimulus with the orthogonal orientation (y-axis) across mice (gray dots denote different mice; size scaled by the number of neurons of each mouse) in both thalamus (left) and cortex (right), as indicated by data points positioned above the diagonal. F, Histograms of single-neuron adaptation ratios (log transformed) in thalamus (left) and cortex (right). Negative x values indicate adaptation, and the red dashed line marks zero adaptation (i.e., equal firing rates for repeat and orthogonal conditions). The triangle shape indicates the mean adaptation across the population of neurons with p-value indicating the significance of the population mean. AL, Anterolateral; AM anteromedial, LM, lateromedial; PM, posteromedial; RL, rostrolateral.
