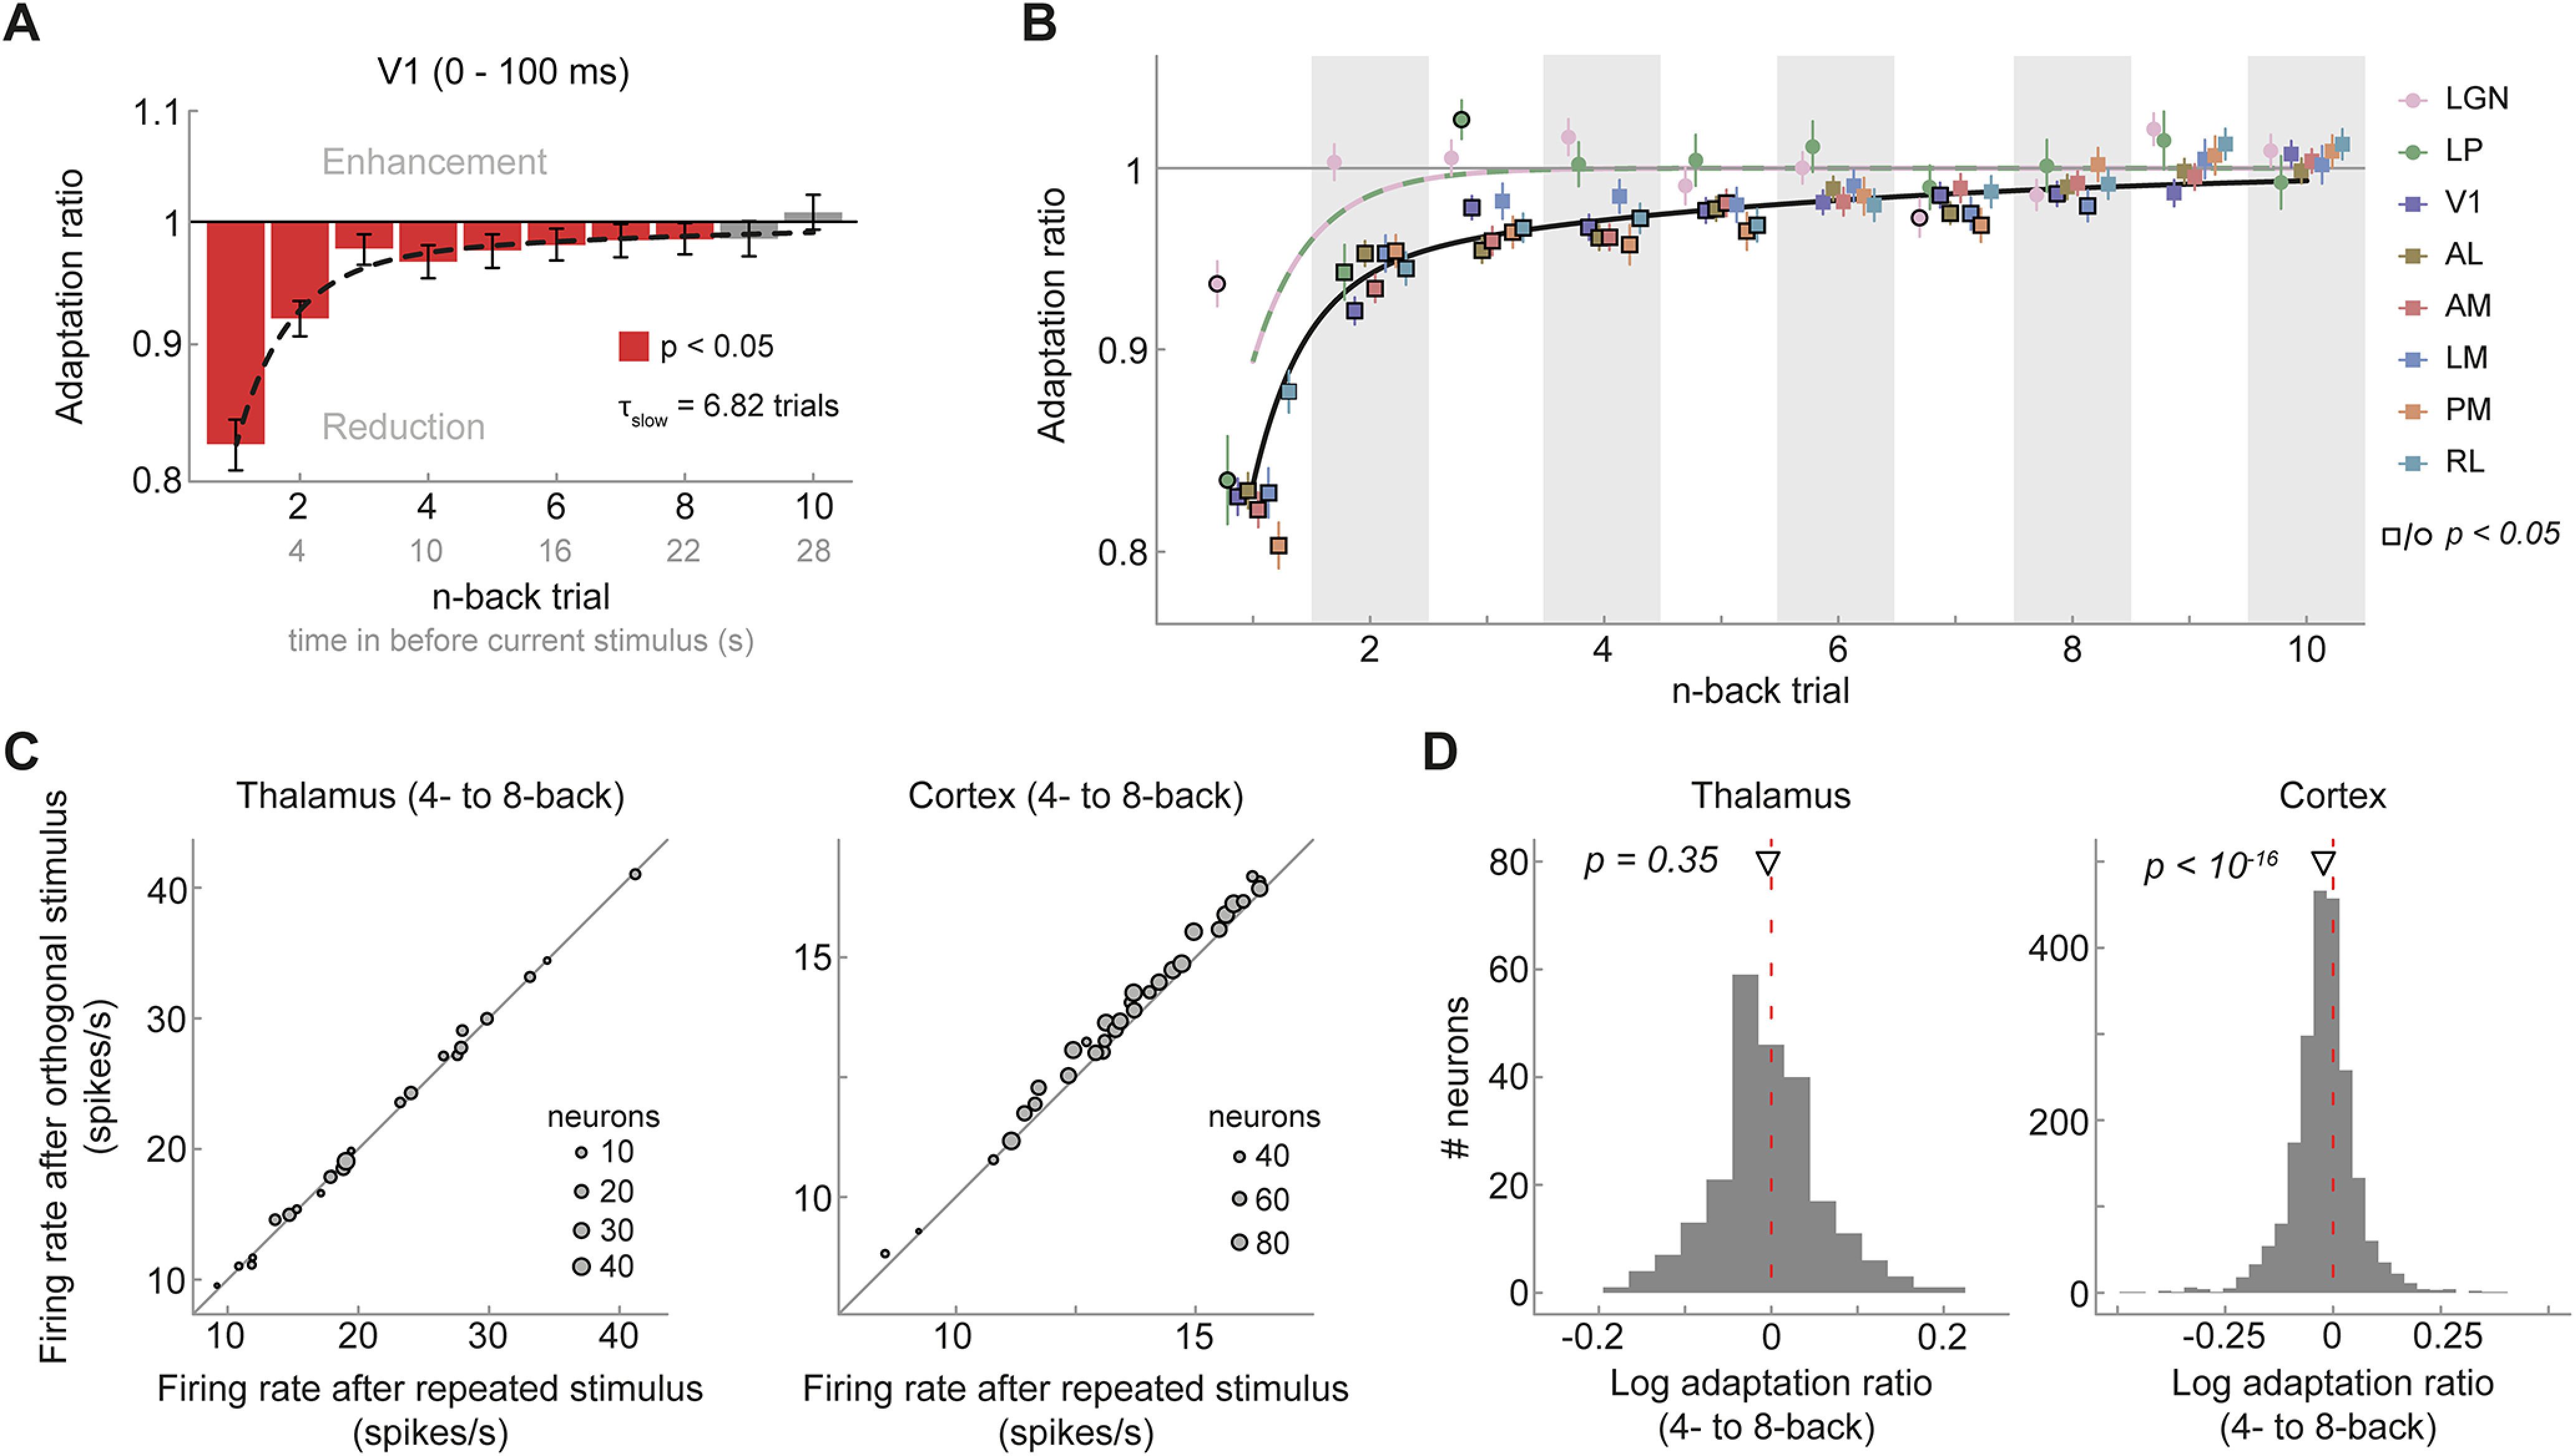
Figure 3.

Visual cortex, but not thalamus, exhibits long-term adaptation. A, Adaptation ratios of neurons in V1 as a function of the n-back trial. Strongest adaptation occurred in response to the 1-back stimulus, but stimuli encountered up to eight presentations in the past (seen 22 s ago) still exerted significant adaptation effect on the current visual response, despite the presentation of intervening stimuli (red bars, p < 0.05, corrected for multiple comparisons). The decay of adaptation over n-back trials was well captured by a double-exponential decay model with a fast- and slow-decaying adaptation component (black dashed line; afast = 13.99%, τfast = 0.85 trials, aslow = 3.45%, τslow = 6.82 trials). Error bars denote bootstrapped 95% confidence intervals. B, Adaptation ratio as function of n-back trial for different visual areas (color coded). Although adaptation decays similarly and slowly across cortical visual areas (square symbols) and are generally significant for up to 6–8 trials back (symbols with black border, p < 0.05, corrected for multiple comparisons per area), it decays more rapidly in thalamic areas LGN and LP (circles). Black and lilac/green lines illustrate the best fitting exponential decay models for cortex and thalamus. Error bars indicate SEM. C, Average firing rates per mouse when the 4- to 8-back orientation was repeated (x-axis) or orthogonal (y-axis) relative to the current orientation. Mice exhibit consistent long-term adaptation in cortex (right) but not in thalamus (left). D, Histograms of single-neuron adaptation ratios (log transformed) in thalamus (left) and cortex (right).
