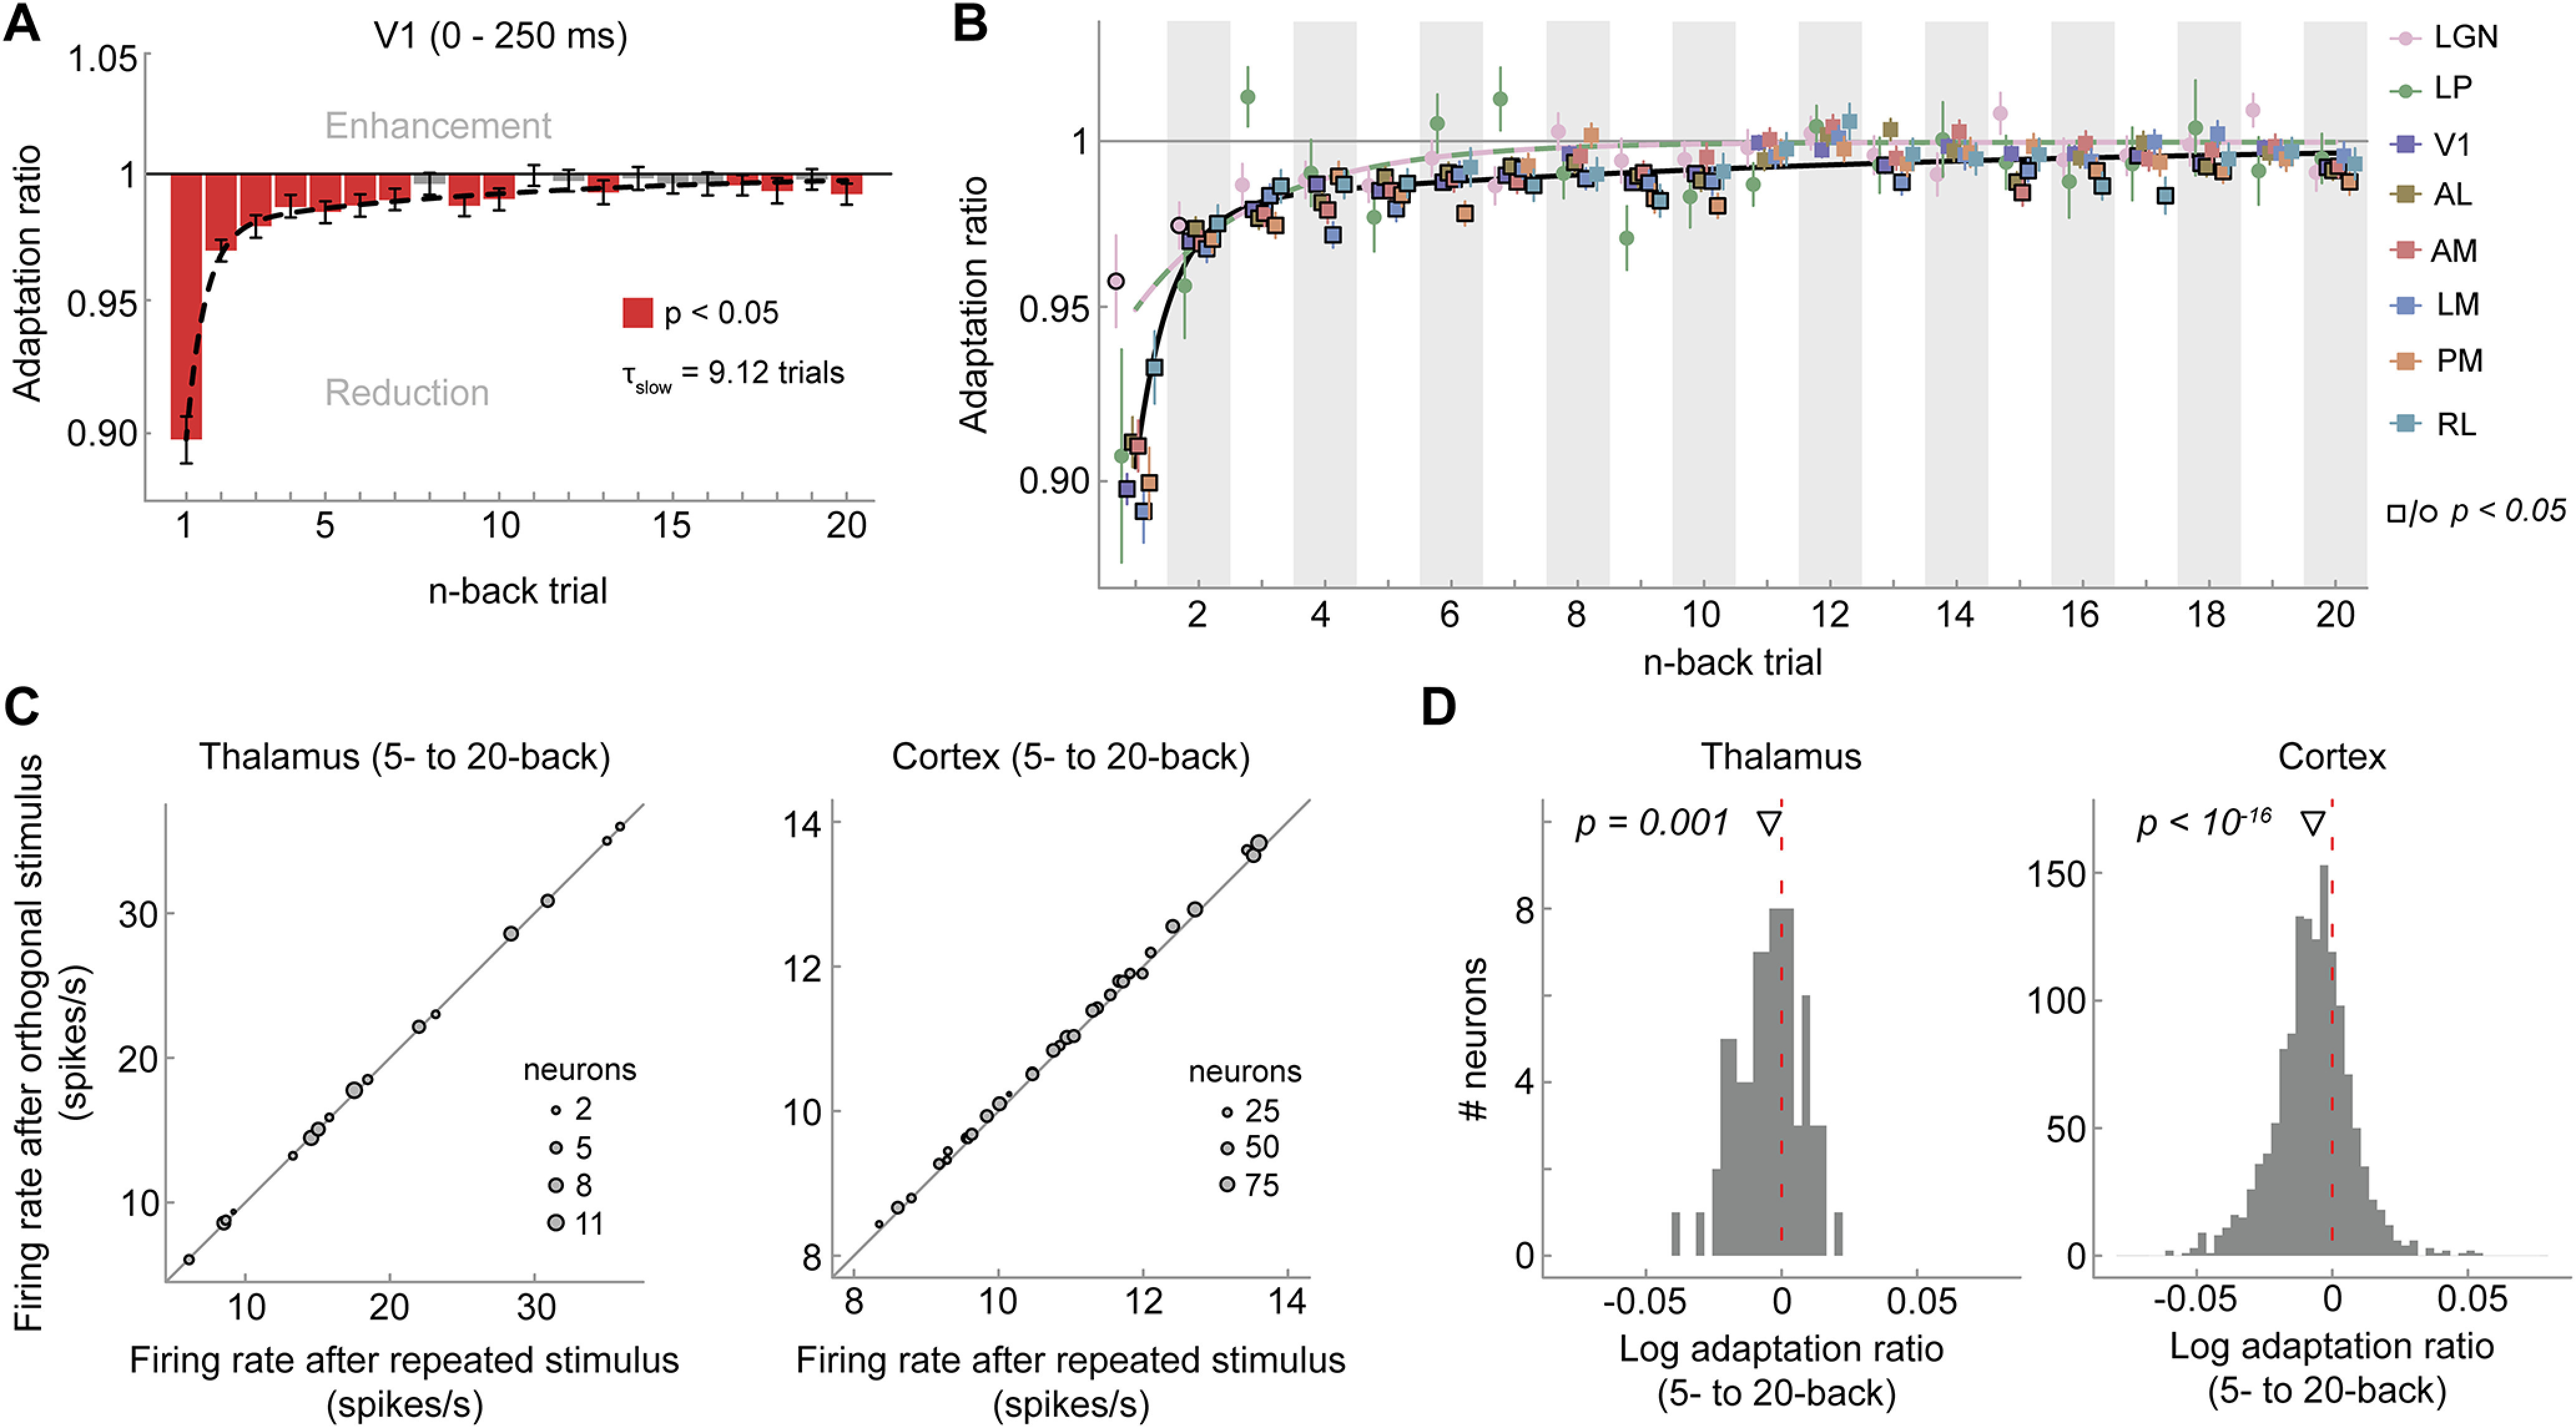
Figure 7.

Visual cortex exhibits long-term adaptation following briefly presented gratings. A, Adaptation ratios of V1 as a function of the n-back trial. Although adaptation was most strongly driven by the previous stimulus (1-back), stimuli encountered up to 20 presentations in the past (5 s ago) still exerted significant adaptation effects on the current visual response (red bars, p < 0.05, FDR corrected). Similar to drifting grating adaptation, the decay of adaptation over n-back trials was well captured by a double-exponential decay model with a fast- and slow-decaying adaptation component (black dashed line; afast = 8.17%, τfast = 0.54 trials, aslow = 2.04%, τslow = 9.12 trials). Error bars indicate bootstrapped 95% confidence intervals. B, Adaptation ratios as a function of n-back trial for different visual areas (color coded). In cortical areas (squares) there is significant adaptation to stimulus orientations presented up to 20 trials back (symbols with black border, p < 0.05, FDR corrected per area), whereas in thalamic areas (circles) long-term adaptation is less evident. Error bars indicate SEM. Black and orange/green lines denote the best fitting exponential decay models for cortex and thalamus, respectively. Adaptation was computed over the whole stimulus interval (0–250 ms) because with the back-to-back presentation of static gratings, visual responses to the previous stimulus overlapped with the initial time window of the current stimulus, thereby increasing response variability in this early time window. However, largely similar results were obtained when performing the analyses on the same time window used in the drifting grating experiment (0–100 ms), except for a less clear difference of the decay of adaptation between cortex and thalamus. C, Average firing rates per mouse when the 5- to 20-back orientation was repeated (x-axis) or orthogonal (y-axis) relative to the current orientation in the thalamus (left) and cortex (right). D, Histograms of single-neuron long-term (average 5–20 back) adaptation ratios (log transformed) in thalamus (left) and cortex (right).
