Figure 6.

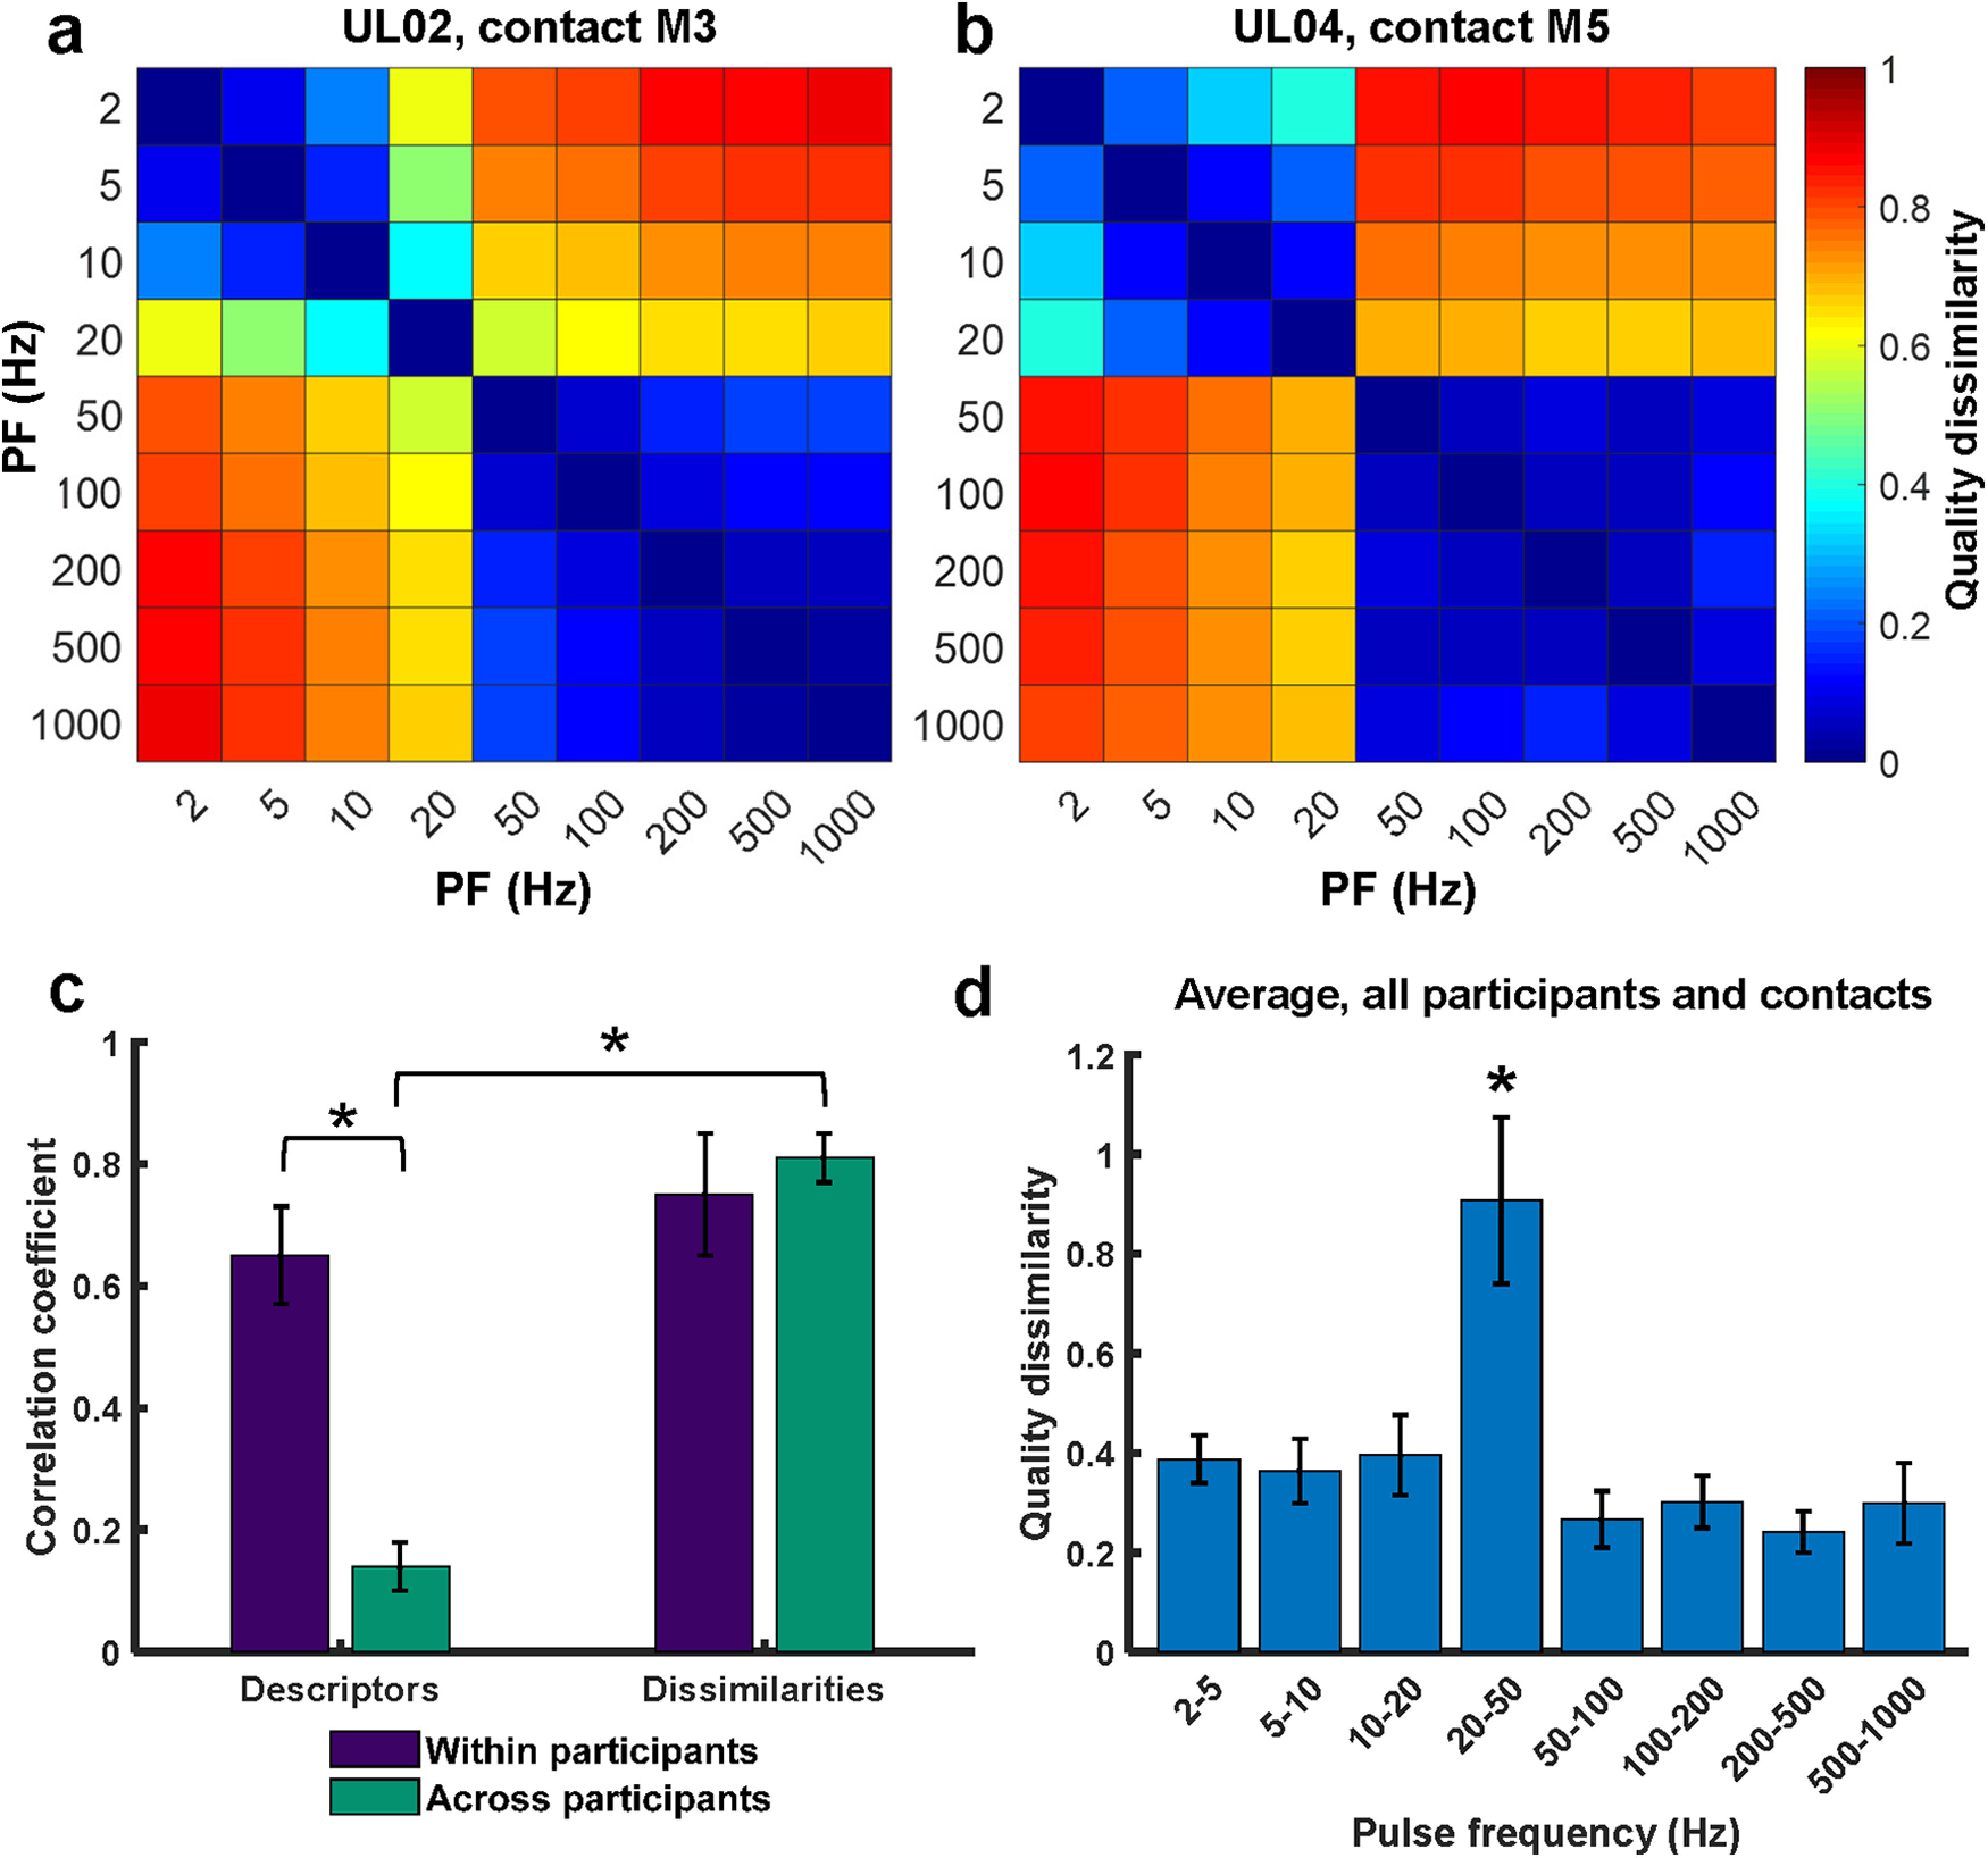
Perceived dissimilarity estimated from differences in descriptor usage. a, Perceived dissimilarity of stimuli varying in PF for contact M3 of participant UL02. b, Perceived dissimilarity of stimuli varying in PF for contact M5 of participant UL04. c, Within-participant (n = 8, purple) and across-participant (n = 15, teal) pairwise correlations for two metrics of quality. “Descriptors” denotes the words selected by the participant for each stimulus, and “Dissimilarities” denotes the Euclidean distance between pairs of stimulation conditions. Error bars denote the SEM. Asterisks denote statistically significant differences with p < 0.001. d, Perceived dissimilarity between successive PF conditions, averaged across PWs (n = 33). Error bars indicate the SEM. The asterisk denotes significance at p < 0.001.
