. 2022 Feb 25;11:e71994. doi: 10.7554/eLife.71994

Figure 3. Impact of dropouts on ssGSEA signature scoring.

(A) Percentages of up and down regulated gene signatures in original cells relative to down sampled cells for four levels of down sampling (20, 40, 60, and 80%) based on Cohen’s d. Dot size corresponds to the percentage of all signatures tested (n = 7503) in Head and Neck (Puram et al., 2017). (B) Effect of dropouts on ssGSEA scoring using a dummy expression matrix. The black line denotes the cell without any dropouts, and the blue line denotes the same cell with a 60% dropout rate. Note that for the gene signature, the first 99 genes are fixed. The x axis reflects the position of the last signature gene. When the gene is at rank <4000. The two cells give identical scores. However, after entering dropout zone, the scores start to deviate.

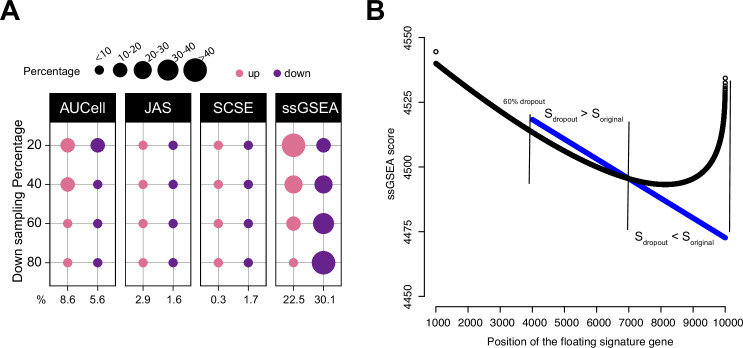
Figure 3—source data 1. Source data for Figure 3.

Figure 3.

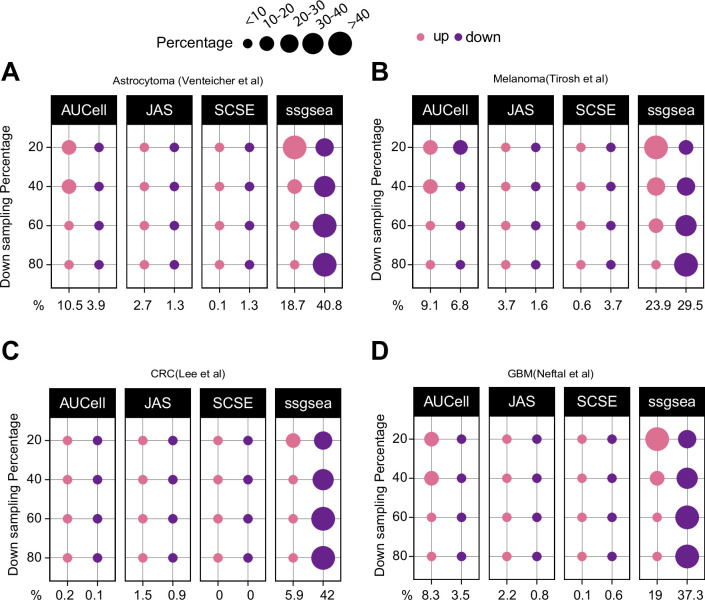
Figure 3—figure supplement 1. Down sampling levels affect signature scoring.

Figure 3—figure supplement 1.

Percentage of up and down regulated gene signatures in original cells relative to down sampled cells for four levels of down sampling (20, 40, 60, and 80%) based on Cohen’s d. Dot size corresponds to the percentage of all signatures tested (n = 7503) (A) in astrocytoma, (B) melanoma, (C) colorectal cancer, and (D) in glioblastoma data.
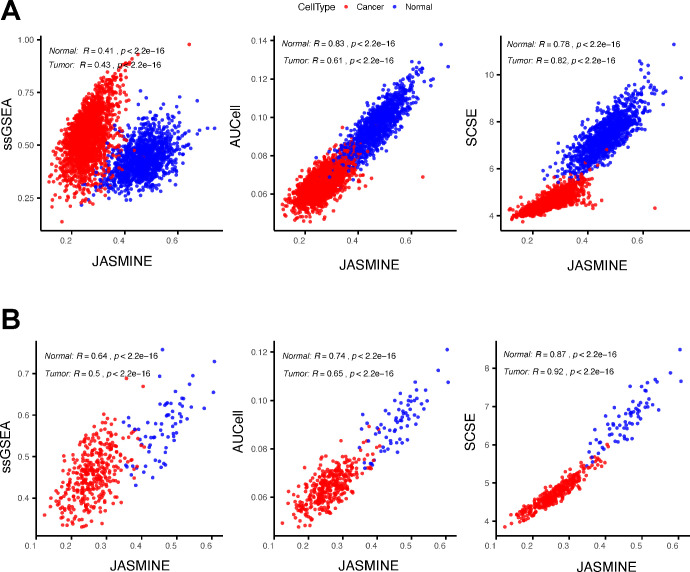
Figure 3—figure supplement 2. An example showing ssGSEA score changes.

Figure 3—figure supplement 2.

(A) Comparing scores of a gene signature (‘ZNF597_TARGET_GENES’) between JASMINE and other tools in all tumor and normal cells using the head and neck data. (B) The same comparison but limited to cells with the number of expressed genes between 4000 and 5000.