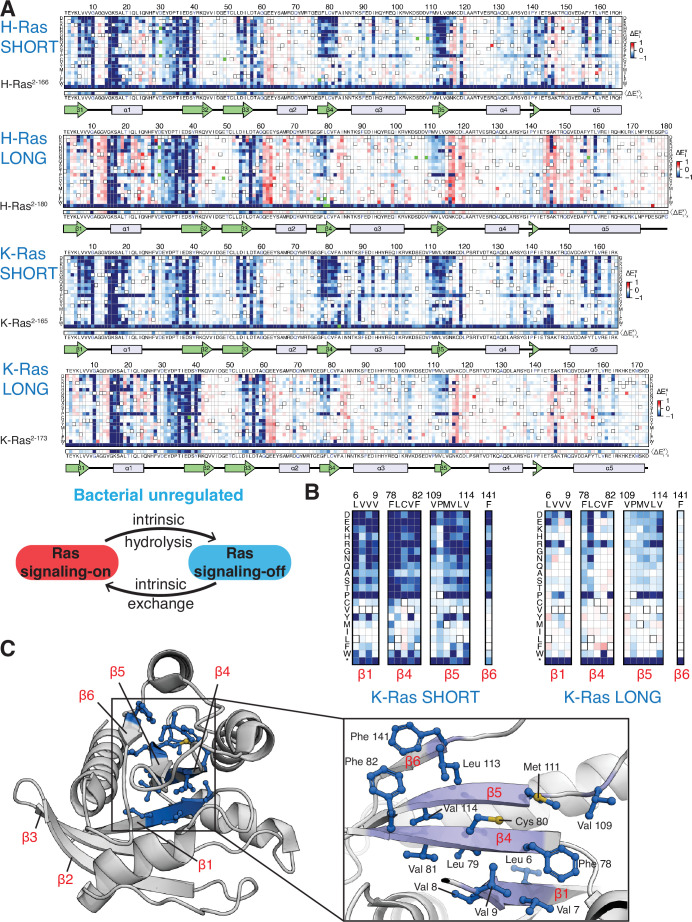
Figure 3. Mutational tolerance of Ras long and short constructs in the unregulated bacterial experiment.
(A) H-Ras2-166, H-Ras2-180, K-Ras2-165, and K-Ras2-173 in the unregulated experiment. The relative enrichment values () shown are the mean of three, four, two, and four biological replicates, respectively. Stop codons are labeled as ‘*’, and the bottom strip displays the functional effect of all amino acid substitutions at each position () – the average taken over each column. (B–C) Comparison of the mutational tolerance of residues in the hydrophobic core of K-Ras in the shorter and longer constructs. The enrichment scores for the hydrophobic core residues are shown for the two K-Ras constructs in B, and mapped onto K-Ras structure in C. PDB ID: 4OBE (Hunter et al., 2015).


